This post covers how to define layouts and export media files for data and results from the Soil Moisture Active Passive (SMAP) mission in Karttur’s GeoImagine Framework.
Prerequisites
You must have completed the data processing of SMAP data in the previous post.
SMAP
Project module
The project module file (projSMAP.py) is available in the Project package projects.
The project file links to an ASCII text file that contains a list of the xml files to execute. The layout and export processes are under the folder Layout.
projFN ='doc/Layout/smap-layout_YYYYMMDD.txt'
As the path to the project file does not start with a slash “/”, the path is relative to the project module itself. The project package available on Karttur’s GitHub page contains the path and the files required for running the process chain.
###################################
###################################
###             SMAP            ###
###################################
###################################

###################################
###             Layout          ###
###################################

## Create scaling for smap compids ##
#SMAP-0001_createscaling.xml

## Create palettes for smap ##
#SMAP-0002_createpalettes.xml

## Create legend for smap ##
#SMAP-0003_createlegends.xml

## Create movie clock for smap##
#SMAP-0004_createmovieclock.xml

###################################
###        Export media         ###
###################################

## Export 16D SMAP ##
#SMAP-0900_ExporttoByte_16D.xml

## Export seasonal signals 16D ##
#SMAP-0905_ExporttoByte_16D-seasons.xml

###        Movie         ###

## Create image frames ##
#SMAP-0950_movieframes_16D-seasons.xml
#SMAP-0950_movieframes_16D

## Create clock frames and movie ##
#SMAP-0960_movieclock_16D-seasons.xml
#SMAP-0960_movieclock_16D
Layout
Processing to pleasing looking maps requires that different layout aspects are pre-defined, including:
scaling
legends
palettes
movieclock
You must define scaling and palettes. You need legends if you want to add that to your map layouts. You can also define a customized layout of the clock and time line for animations, but you can also use the Framework default.
Scaling
To export a layer to a color map the scaling must be set using the process createscaling. All exported maps are in byte format (valid numerical range between 0 and 255). Thus all compositions that are not defined as byte must be rescaled to fit between 0 and 255. The Framework default is to use 255 to denote nodata and values between 251 and 255 for layout.
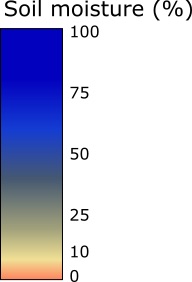
To set up a palette, use the process addrasterpalette. In the example below three different SMAP related palettes are defined: for soil moisture (vol/vol), for change in soil moisture and for variations in soil moisture.
<?xml version='1.0' encoding='utf-8'?>
<palette>
<userproj userid = 'karttur' projectid = 'karttur' tractid= 'karttur' siteid = '*' plotid = '*' system = 'system'></userproj>
<path></path>


<!-- addrasterpalette smap-->
<process processid = 'addrasterpalette'>
<overwrite>Y</overwrite>
<delete>N</delete>
<parameters palette = 'smap' compid='test'>
<setcolor id = '0' red = '255' green ='132' blue='94' alpha ='0' label='0' hint='0' ></setcolor>
<setcolor id = '25' red = '240' green ='224' blue='148' alpha ='0' label='10' hint='NA' ></setcolor>
<setcolor id = '50' red = '162' green ='162' blue='122' alpha ='0' label='50' hint='no correlation' ></setcolor>
<setcolor id = '100' red = '70' green ='89' blue='112' alpha ='0' label='100' hint='positive correclation' ></setcolor>
<setcolor id = '150' red = '20' green ='60' blue='210' alpha ='0' label='150' hint='positive correclation' ></setcolor>
<setcolor id = '200' red = '2' green ='1' blue='190' alpha ='0' label='200' hint='strong positive correlation' ></setcolor>
<setcolor id = '250' red = '2' green ='1' blue='190' alpha ='0' label='250' hint='strong positive correlation' ></setcolor>
<setcolor id = '253' red = '245' green ='237' blue='182' alpha ='0' label='dry (0)' hint='completely dry' ></setcolor>
<setcolor id = '254' red = '32' green ='32' blue='32' alpha ='255' label='frame' hint='frame' ></setcolor>
<setcolor id = '255' red = '250' green ='250' blue='250' alpha ='255' label='255' hint='no data' ></setcolor>
</parameters>
</process>

<!-- addrasterpalette smapdelta-->
<process processid = 'addrasterpalette'>
<overwrite>Y</overwrite>
<delete>N</delete>
<parameters palette = 'smapdelta' compid='test'>
<setcolor id = '0' red = '200' green ='50' blue='0' alpha ='0' label='0' hint='strongly negative correlation' ></setcolor>
<setcolor id = '62' red = '255' green ='225' blue='30' alpha ='0' label='63' hint='negative correlation' ></setcolor>
<setcolor id = '125' red = '190' green ='190' blue='190' alpha ='0' label='125' hint='positive correclation' ></setcolor>
<setcolor id = '187' red = '20' green ='110' blue='200' alpha ='0' label='188' hint='strong positive correlation' ></setcolor>
<setcolor id = '250' red = '2' green ='1' blue='143' alpha ='0' label='250' hint='strong positive correlation' ></setcolor>
<setcolor id = '253' red = '245' green ='237' blue='182' alpha ='0' label='dry (0)' hint='completely dry' ></setcolor>
<setcolor id = '254' red = '32' green ='32' blue='32' alpha ='255' label='frame' hint='frame' ></setcolor>
<setcolor id = '255' red = '250' green ='250' blue='250' alpha ='255' label='255' hint='no data' ></setcolor>
</parameters>
</process>

<!-- addrasterpalette smapstd-->
<process processid = 'addrasterpalette'>
<overwrite>Y</overwrite>
<delete>N</delete>
<parameters palette = 'smapstd' compid='test'>
<setcolor id = '0' red = '200' green ='200' blue='200' alpha ='0' label='125' hint='positive correclation' ></setcolor>
<setcolor id = '50' red = '240' green ='224' blue='148' alpha ='0' label='188' hint='strong positive correlation' ></setcolor>
<setcolor id = '100' red = '162' green ='162' blue='122' alpha ='0' label='188' hint='strong positive correlation' ></setcolor>
<setcolor id = '150' red = '70' green ='89' blue='112' alpha ='0' label='250' hint='strong positive correlation' ></setcolor>
<setcolor id = '200' red = '20' green ='60' blue='210' alpha ='0' label='250' hint='strong positive correlation' ></setcolor>
<setcolor id = '250' red = '2' green ='1' blue='190' alpha ='0' label='250' hint='strong positive correlation' ></setcolor>
<setcolor id = '253' red = '245' green ='237' blue='182' alpha ='0' label='dry (0)' hint='completely dry' ></setcolor>
<setcolor id = '254' red = '32' green ='32' blue='32' alpha ='255' label='frame' hint='frame' ></setcolor>
<setcolor id = '255' red = '250' green ='250' blue='250' alpha ='255' label='255' hint='no data' ></setcolor>
</parameters>
</process>


</palette>
Create legend
To create legends for use together with maps, use the process createlegend.
With the process exportlegend you can create stand alone legends. To work you must have defined the scaling, the palette and the legend in the previous steps. The process produces three legends, as a Scalable Vector Graphics (.svg file), a .png file and a compressed .jpg file. The svg is saved as a www compliant xml, and you can use it either for editing in a graphics program or inclusion in a web-page (or both).
<?xml version='1.0' encoding='utf-8'?>
<exportlegend>
<userproj userid = 'karttur' projectid = 'karttur' tractid= 'karttur' siteid = '*' plotid = '*' system = 'system'></userproj>


<!-- Export legend -->

<!-- NOTE THE ID IS OLNLY USED IN THE SCRIPTING SO IT CAN HAVE (UNIQUE) DUMMY VALUES HERE -->
<!-- GRACE monthly cmwater-->
<process processid = 'exportlegend' version = '1.3'>
<overwrite>True</overwrite>
<parameters palette='smap'></parameters>
<dstpath volume='/Users/thomasgumbricht'></dstpath>
<comp id = '1' source = "SPL3SMP.005" product = "SPL3SMP" folder = "soil-moisture-am" band = "soil-moisture-am" prefix = "soil-moisture-am" suffix = "005"></comp>
<comp id = '2' source = "SPL3SMP.005" product = "SPL3SMP" folder = "soil-moisture-pm" band = "soil-moisture-pm" prefix = "soil-moisture-pm" suffix = "005"></comp>
<comp id = '3' source = "SPL3SMP.005" product = "SPL3SMP" folder = "soil-moisture-avg" band = "soil-moisture-avg" prefix = "soil-moisture-avg" suffix = "005"></comp>
<comp id = '4' source = "SPL3SMP.005" product = "SPL3SMP" folder = "soil-moisture-min" band = "soil-moisture-min" prefix = "soil-moisture-min" suffix = "005"></comp>
<comp id = '5' source = "SPL3SMP.005" product = "SPL3SMP" folder = "soil-moisture-max" band = "soil-moisture-max" prefix = "soil-moisture-max" suffix = "005"></comp>

<comp id = '11' source = "SPL3SMP.005" product = "SPL3SMP" folder = "soil-moisture-am-16D" band = "soil-moisture-am" prefix = "soil-moisture-am" suffix = "005"></comp>
<comp id = '12' source = "SPL3SMP.005" product = "SPL3SMP" folder = "soil-moisture-pm-16D" band = "soil-moisture-pm" prefix = "soil-moisture-pm" suffix = "005"></comp>
<comp id = '13' source = "SPL3SMP.005" product = "SPL3SMP" folder = "soil-moisture-avg-16D" band = "soil-moisture-avg" prefix = "soil-moisture-avg" suffix = "005"></comp>
<comp id = '14' source = "SPL3SMP.005" product = "SPL3SMP" folder = "soil-moisture-min-16D" band = "soil-moisture-min" prefix = "soil-moisture-min" suffix = "005"></comp>
<comp id = '15' source = "SPL3SMP.005" product = "SPL3SMP" folder = "soil-moisture-max-16D" band = "soil-moisture-max" prefix = "soil-moisture-max" suffix = "005"></comp>

<comp id = '21' source = "SPL3SMP.005" product = "SPL3SMP" folder = "soil-moisture-am-16D-sesn" band = "soil-moisture-am" prefix = "soil-moisture-am" suffix = "005"></comp>
<comp id = '22' source = "SPL3SMP.005" product = "SPL3SMP" folder = "soil-moisture-pm-16D-sesn" band = "soil-moisture-pm" prefix = "soil-moisture-pm" suffix = "005"></comp>
<comp id = '23' source = "SPL3SMP.005" product = "SPL3SMP" folder = "soil-moisture-avg-16D-sesn" band = "soil-moisture-avg" prefix = "soil-moisture-avg" suffix = "005"></comp>
<comp id = '24' source = "SPL3SMP.005" product = "SPL3SMP" folder = "soil-moisture-min-16D-sesn" band = "soil-moisture-min" prefix = "soil-moisture-min" suffix = "005"></comp>
<comp id = '25' source = "SPL3SMP.005" product = "SPL3SMP" folder = "soil-moisture-max-16D-sesn" band = "soil-moisture-max" prefix = "soil-moisture-max" suffix = "005"></comp>
</process>

</exportlegend>
movieclock
As part of Karttur´s GeoImagine Framework, time series images can be converted to animations with a timeline and a clock showing the year and the season. To create animations you must have installed the terminal apps ImageMagick (for command line image processing) and ffmpeg (for command line movie making). Here are the links to my blog posts on how to install and use ImageMagick and ffmpeg:
The post on ffmpeg also illustrates the use of the GeoImagine Framework movieclock.
Defining a movieclock
An animation requires a pre-defined movieclock (but usually the “default” movieclock is OK), and that the time series data is first exported and then converted to movie frames.
A movieclock object defines the colors, types and sizes of the elements building the clock and timeline in the animation. Basically you do not need to define any of the elements, they are all defaulted. But if you want other postions, widths, margins, colors etc, all can be set using the process addmovieclock.
Exporting layers requires that you have defined the scaling for the composition and a suitable palette. SMAP layers are exported suing the process exporttobytesmap.
Export time series images
If you want to do a movie (animation) of the SMAP time-series data you have to export all the individual SMAP dates. To make the movie look pleasing it is best to export the force filled 16D period time series. Below, both the force filled time series and the seasonal signals are exported, and then used for creating movie animations.
To create movie frames, you must first have exported the time-series images. You then convert the individual images to movie frames with the process movieframesmap and then create the clock and timeline with the process movieclocksmap. The latter process also generates the shell scripts for joining the map frames and the clock frames, and for assembling the joined frames to a movie. If you set the parameter asscript to False the scripts are called and executed from within the process.
By default the process movieframesmap produces a shell script file that you must execute manually to produce the movie frames. The advantage with the script file is that you can edit the area of the map to appear in the movie as well as the embossed watermark text. The link to the script file is reported by the process.
Create movie clock and timeline
The final step before producing the movie (time series animation) is to create the movie clock/timeline that fits with your movie frames. You need to set the dimensions of the movie clock manually as parameters in the process >movieclocksmap. The process uses a combination of python image processing and ImageMagick commands.
The process also produces two shell script files. The first joins (overlays) the movieclock and the image frames (with ImageMagick), and the second produces the movie using ffmpeg. If you do not set the parameter asscript to False you need to execute both scripts manually as reported by the script.