
This post summarizes the ecoregion map over the Okavango Delta, Botswana that I did back in 1999 together with Jenny McCarty (a visiting PhD student from Sweden) and Terence McCarthy (professor at University of the Witwatersrand [Wits] and leader of the Okavango Research Group at Wits). I was at Wits as a post doc sponsored by the Swedish Royal Academy of Sciences. The mapping project was partly done within the SAFARI 2000 evaluation programme of the MODIS sensor.
The original article Ecoregion classification in the Okavango Delta, Botswana from multitemporal remote sensing was published in a special issue on SAFARI2000 in the Journal of Remote Sensing. The article is also found under its DOI
The ecoregion map is available for download (e.g. as a zipped GeoTiff, or print ready map) towards the end of this post.
Introduction
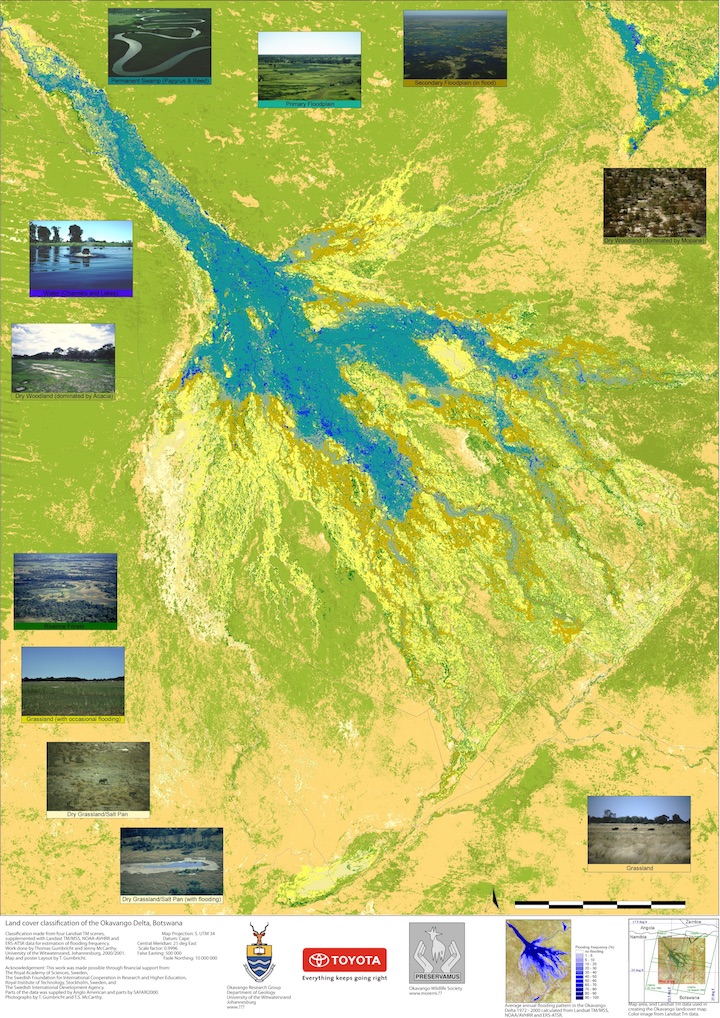
The Okavango Delta, or wetland in Northern Botswana is one of the world’s largest inland alluvial fans. The Delta is composed of thousands of islands in a matrix of wetlands. The wetland system is partly fed by local summer rains, but more water enters through the Okavango River that drains part of the Angolan Highlands (Figure 1). Annual inflow varies largely, and historical evidence shows that flow in the past has been both much larger and much smaller.
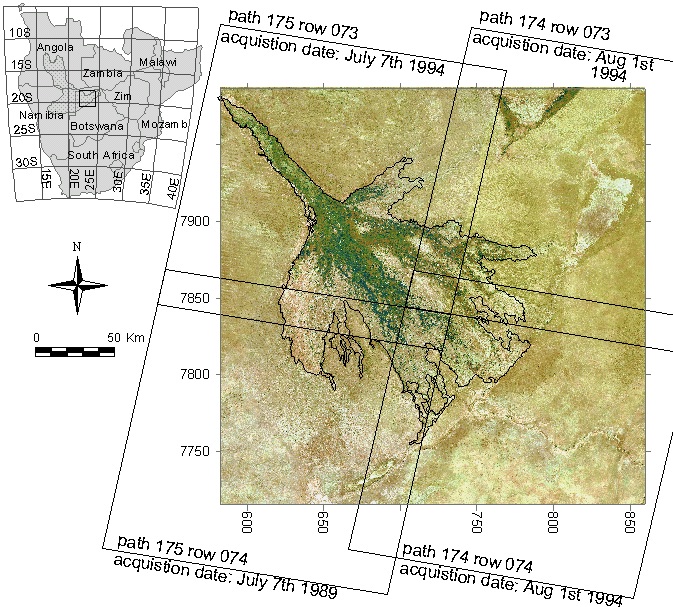
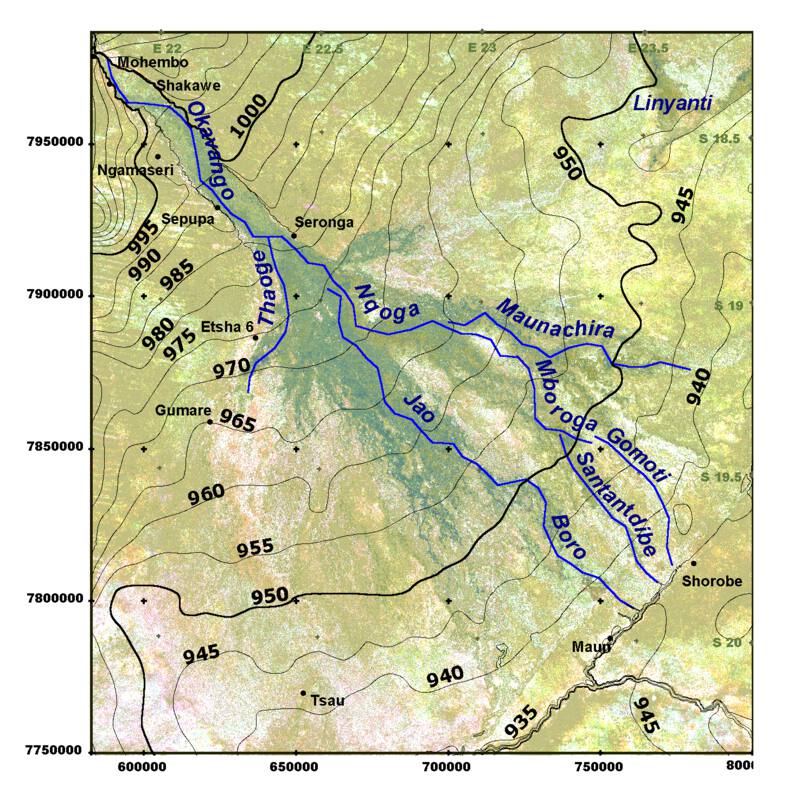
The upper section of the Okavango wetland is confined to a 10 km wide entry valley – the Panhandle. The Panhandle ends at the apex of the true Delta, where also the Okavango River divides into a series of channels (figure 2). Today, water flows from the apex of the Delta to the Nqoga (East) and Jao (South East) channels, with very little water flowing south towards the Thaoge channel. Early travellers, including Livingstone and the Swedish explorer Andersson, reported Thaoge to be the largest channel.
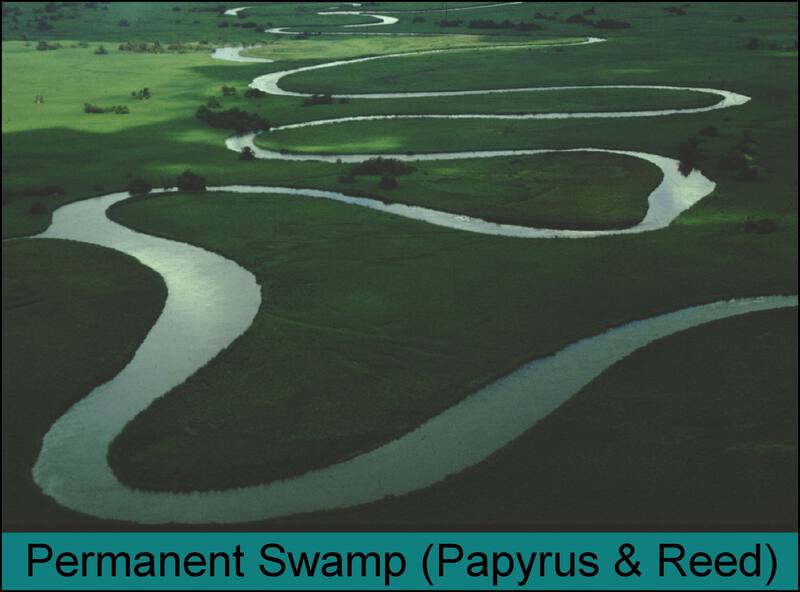
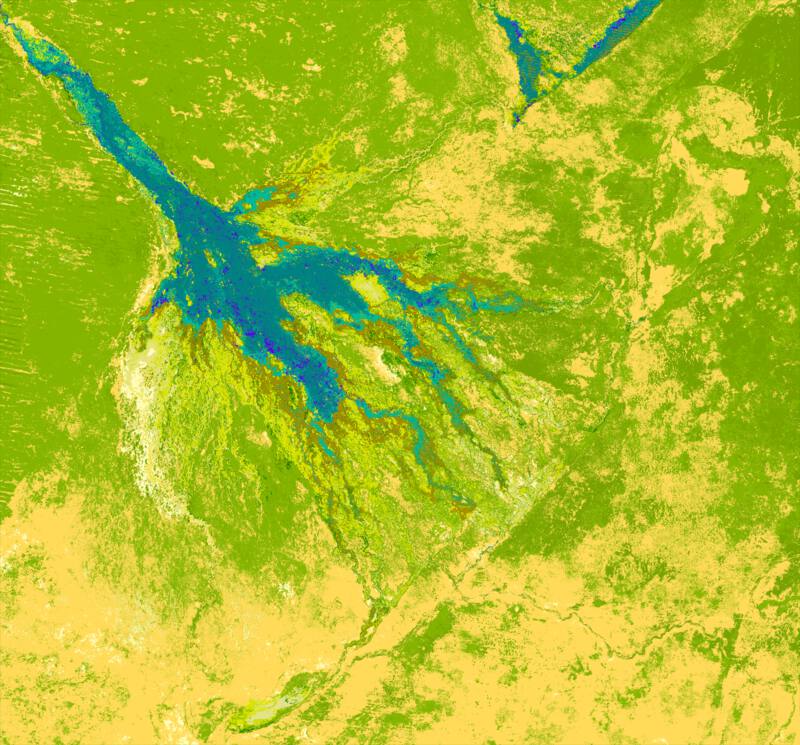
The Panhandle and the upper part of the Delta are flooded with water almost the whole year around, and hence form permanent swamps (figure 3).
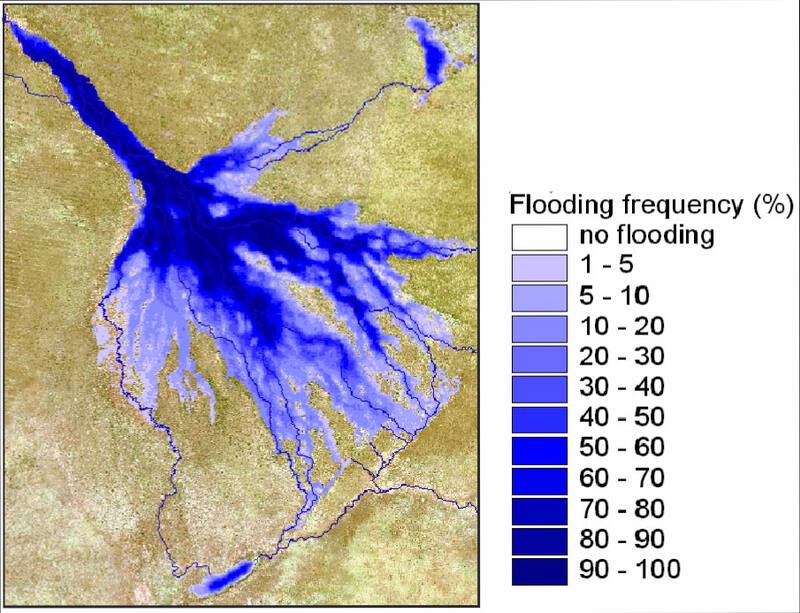
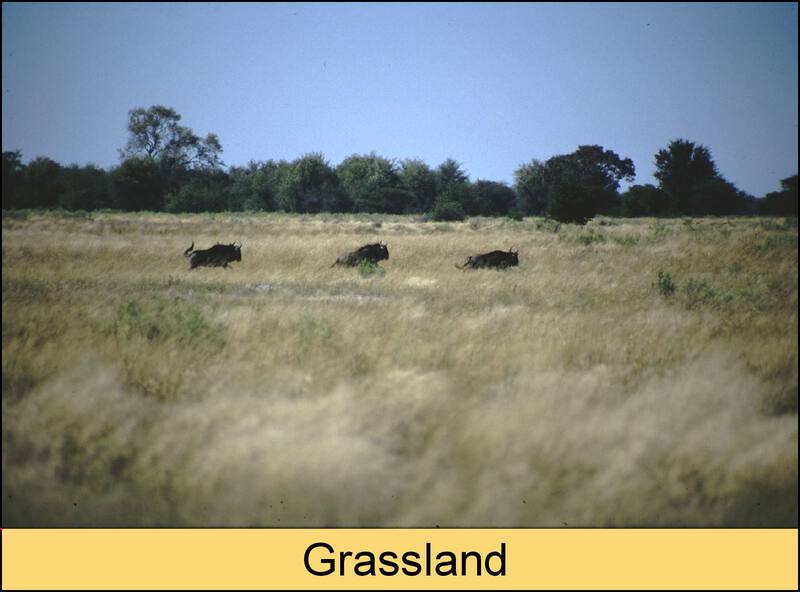
Typical species in the permanent swamp include papyrus and reed, but also less dense stands of other aquatic grasses. Further downstream water only inundates this extremely flat terrain when the floods arrive – forming the seasonal swamps. As it takes water four to six months to travel from the Angolan highlands to the Delta, the flooding occurs during the dry winter season (this post contains an animation showing the rainfall and flooding patterns of the Okavango 2000 to 2016). Hence the wetland is at its largest during the driest season, which of course is of tremendous importance for the wildlife and general ecology of the whole region. Different species of aquatic grasses and sedges dominate different areas of the seasonal swamps, depending on flooding frequency, salinity and water depth.
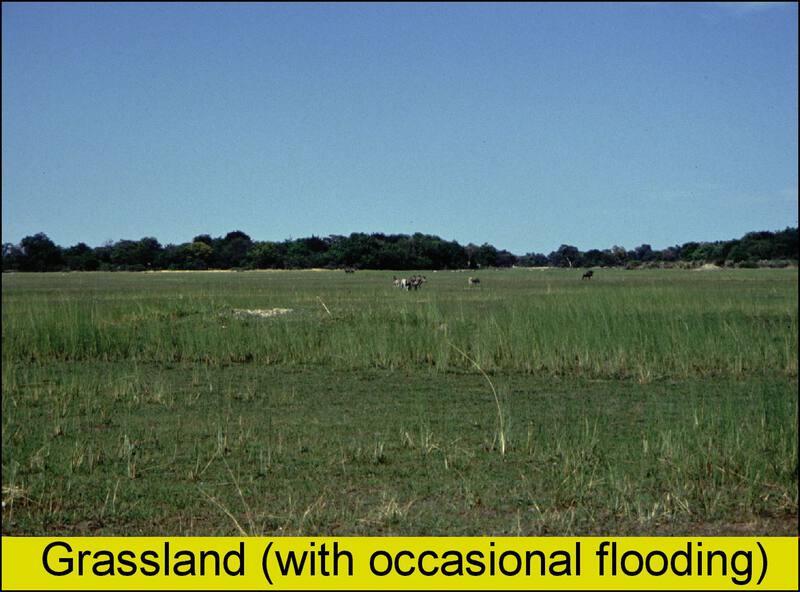
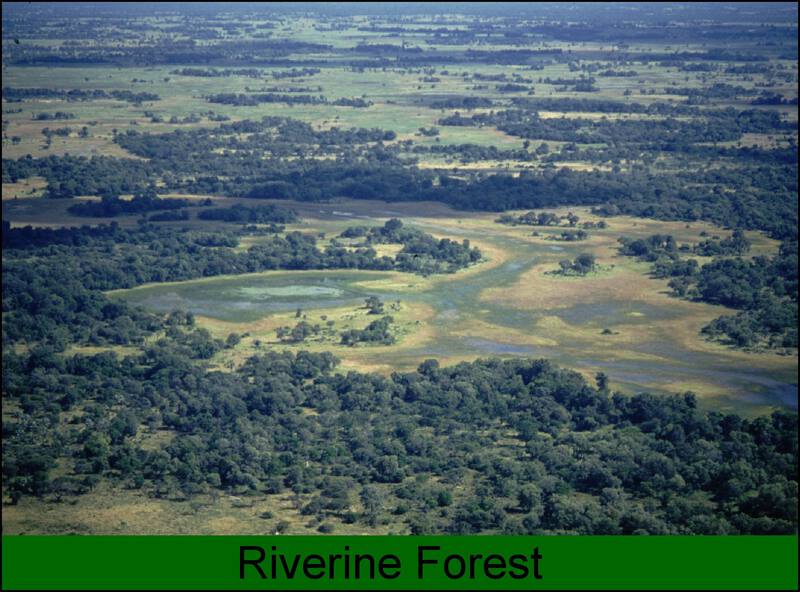
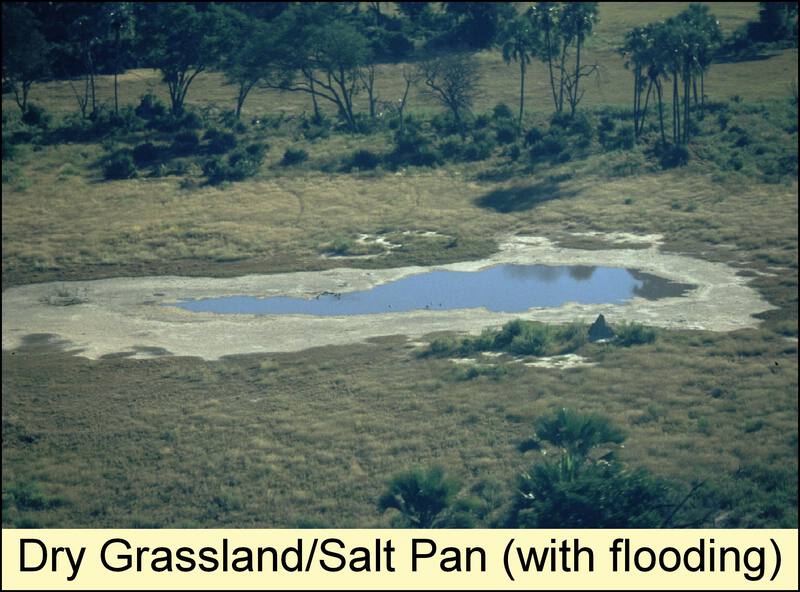
Elevated areas in the flooded regions form islands – if the flooding is less frequent and do not drown the islands they are normally covered by trees (riparian forest). If regularly drowned, grasslands will dominate. The islands are extremely important for regulating the water balance and the salinity of the water, and also for directing flow down the Delta. Evapotranspiration of water from the Delta to the atmosphere is mediated by the vegetation on islands – and hence salt groundwater forms under the islands. This is frequently seen as salt crusts or salt pans on islands.
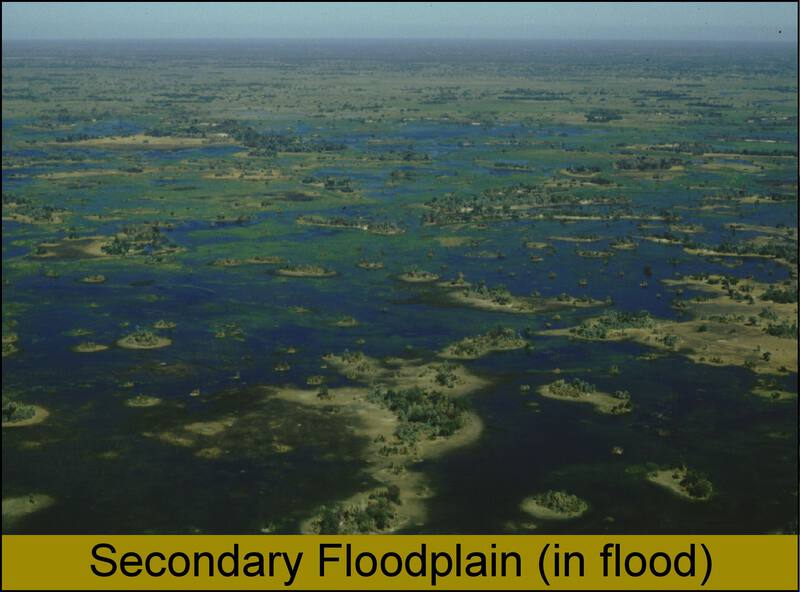
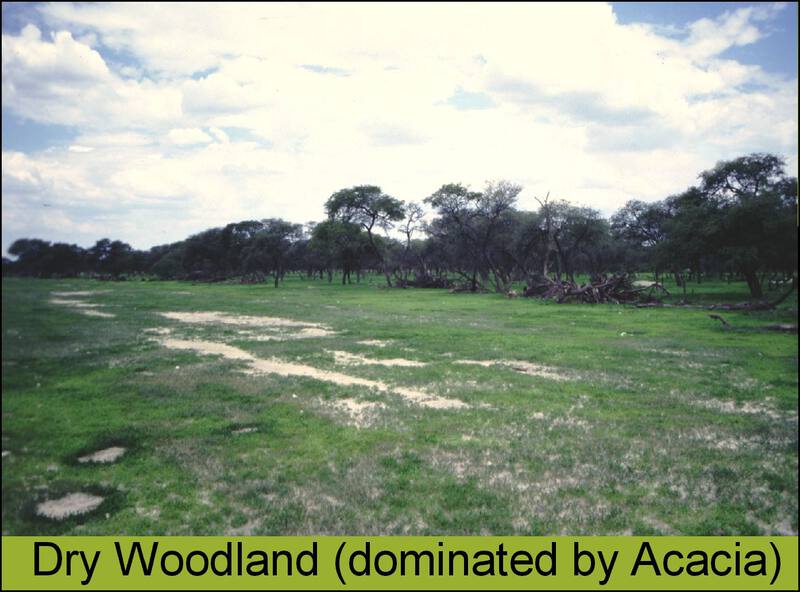
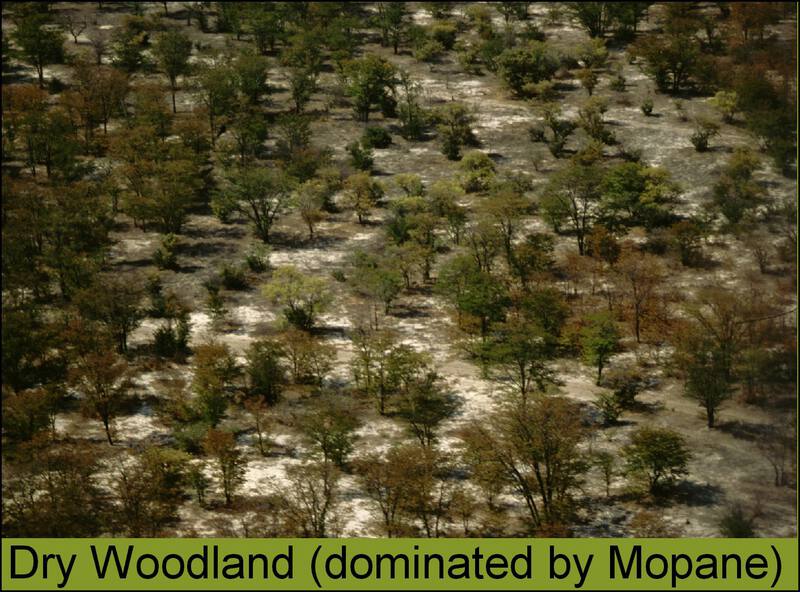
Areas that are even further downstream get flooded only during years with heavy rainfall – hence forming occasional swamps (figure 3). Some parts of the Delta have obviously not been flooded for centuries, and dry woodlands and grasslands (including pasture and grazing land) dominate the landscape. Also here the distribution of different tree species, like mopane and acacia, is of importance for the wildlife. In its distal parts the Delta gradually changes into the surrounding Kalahari Desert.
The occurrence of different types of wetlands, islands and woodland ecoregions is extremely important for understanding how the Okavango functions. Predicting the patterns of wildlife migrations, predator-prey dynamics, or how water will flow under different climatic scenarios, demands a detailed description of the landscape.
Classification methods and materials
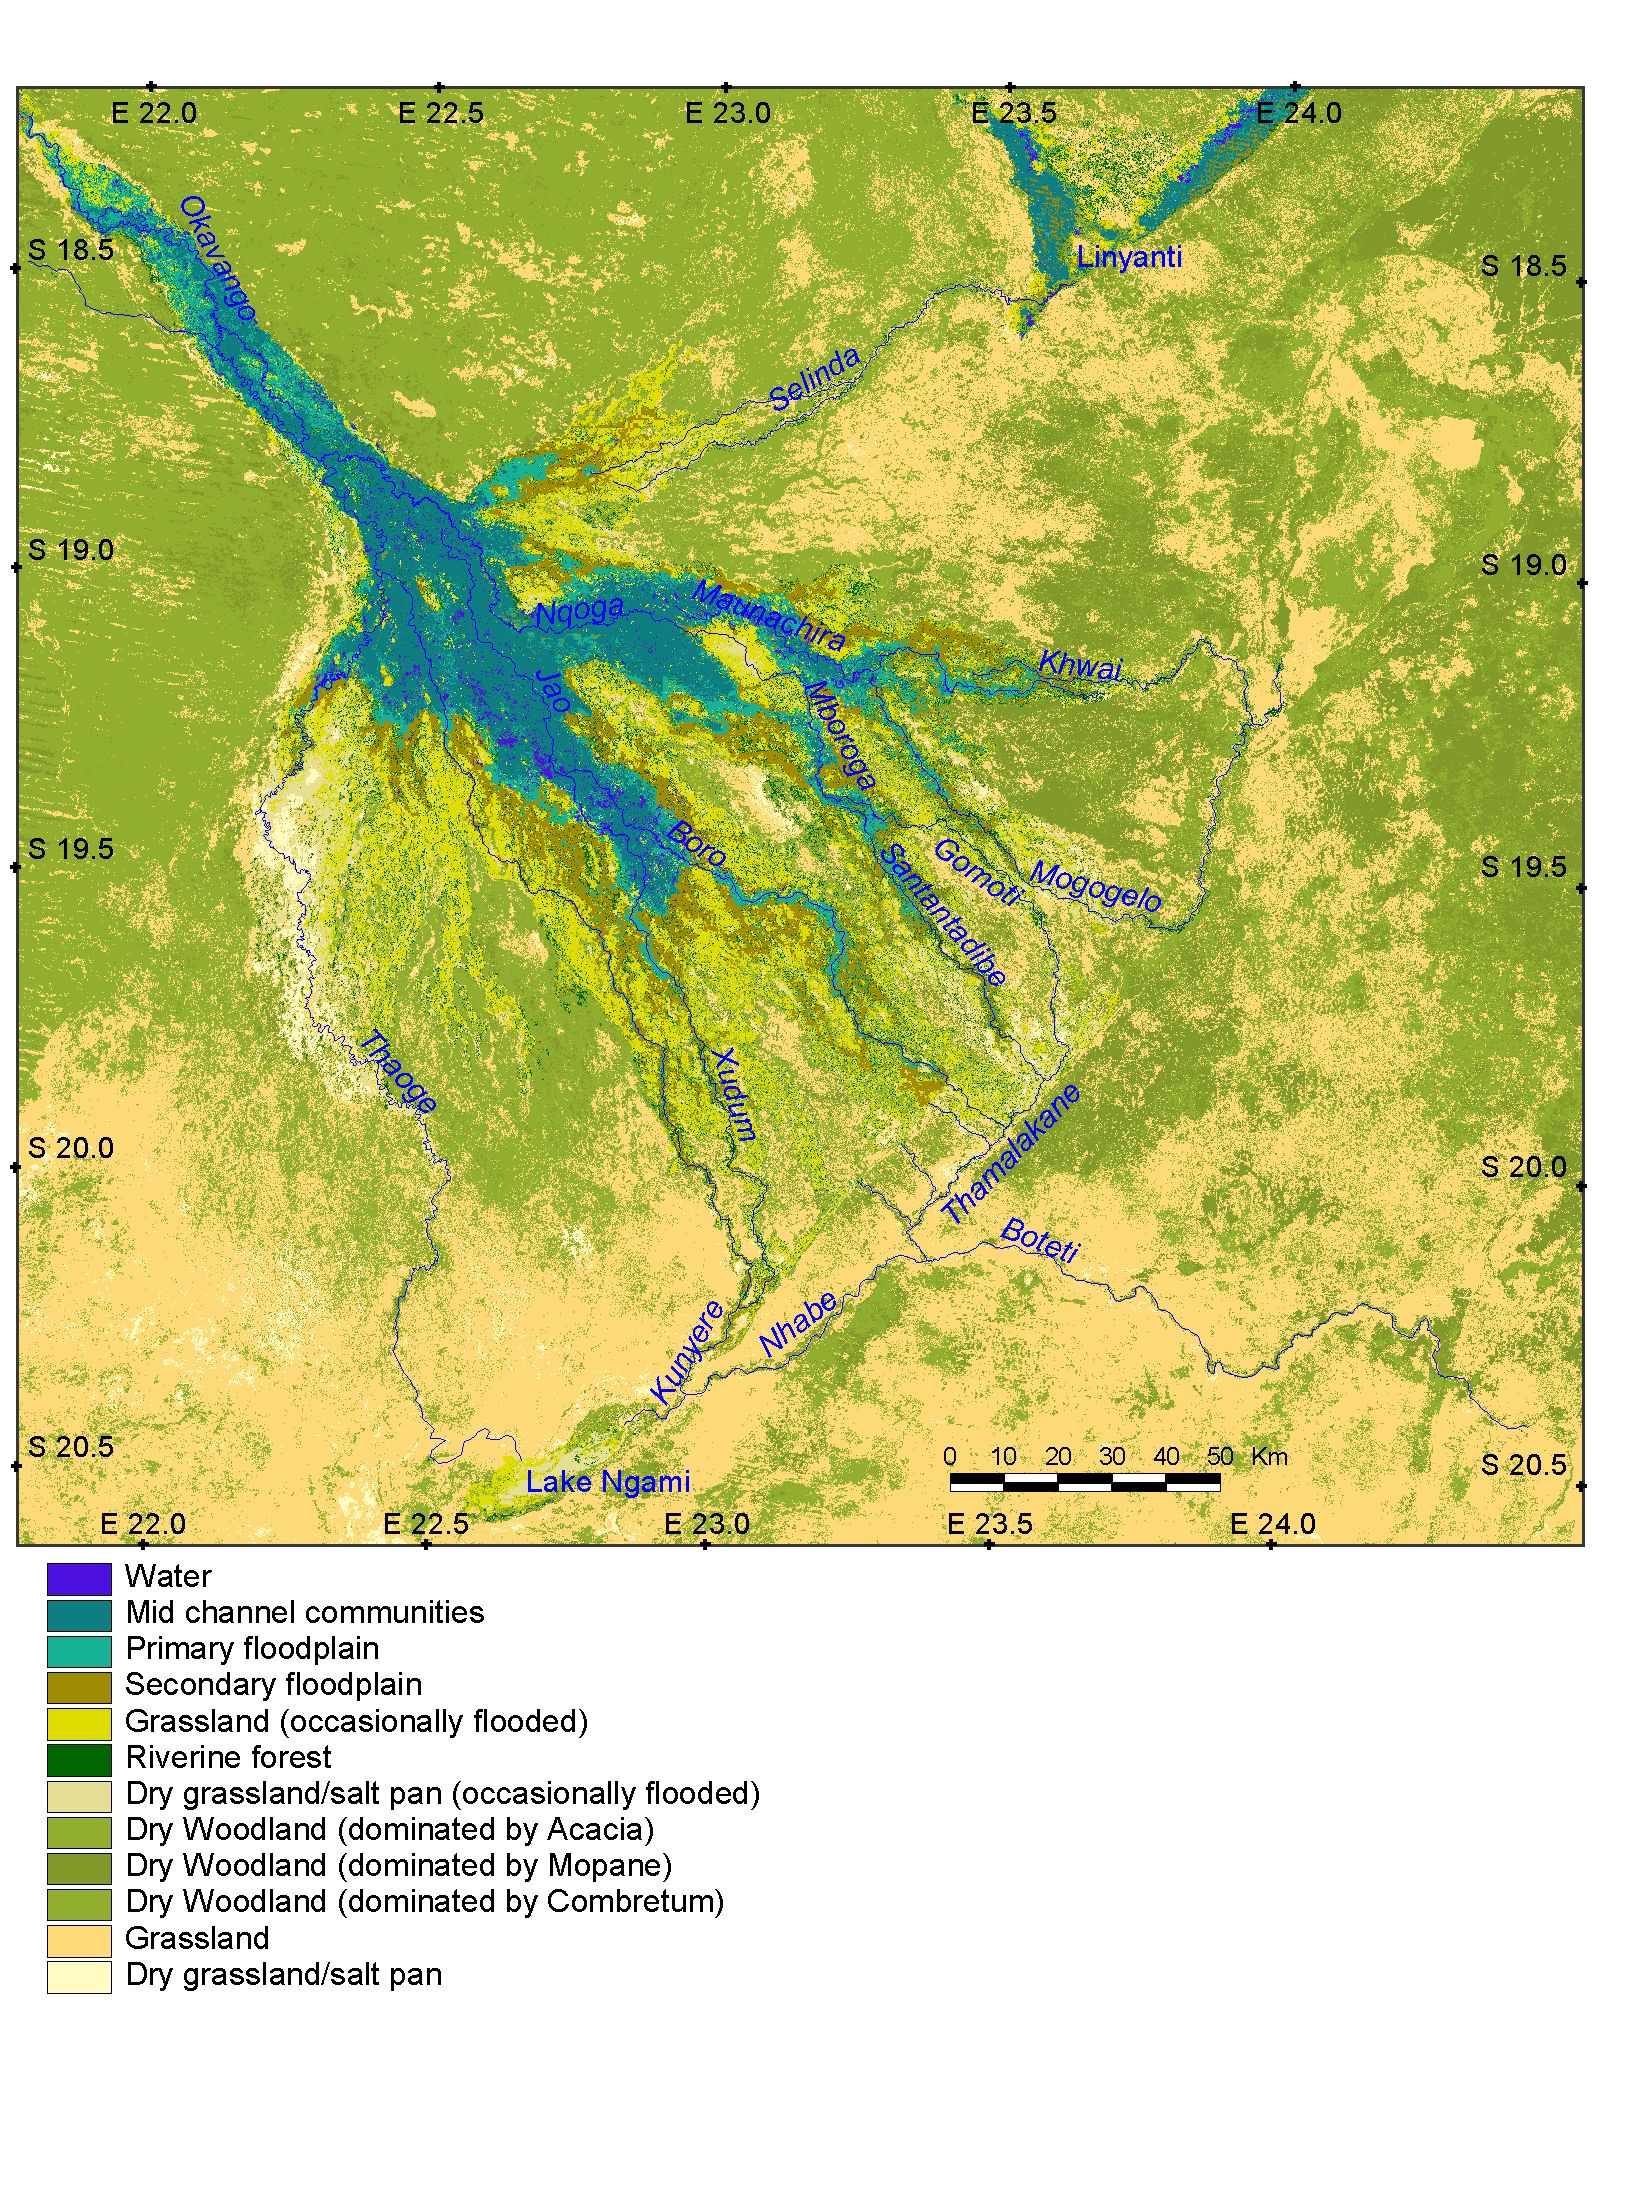
The ecoregion classification was done using 12 classes:
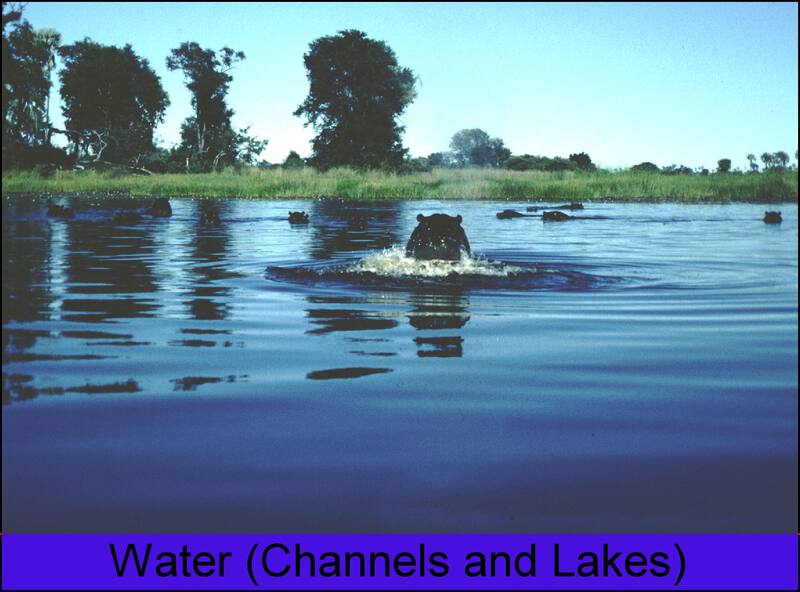
- open water
- permanent wetlands
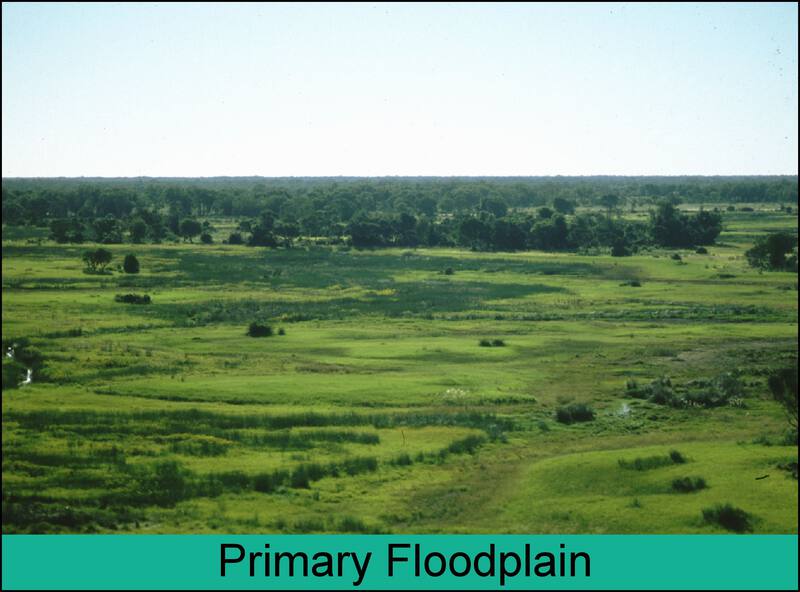
- primary floodplains
- secondary floodplains
- flooded grasslands (wet meadows)
- riparian forests
- occasional flooded grasslands
- dry woodlands (dominated by Acacia)
- dry woodlands (dominated by Mopane)
- dry woodlands (dominated by Combretum)
- dry grasslands
- salt pans
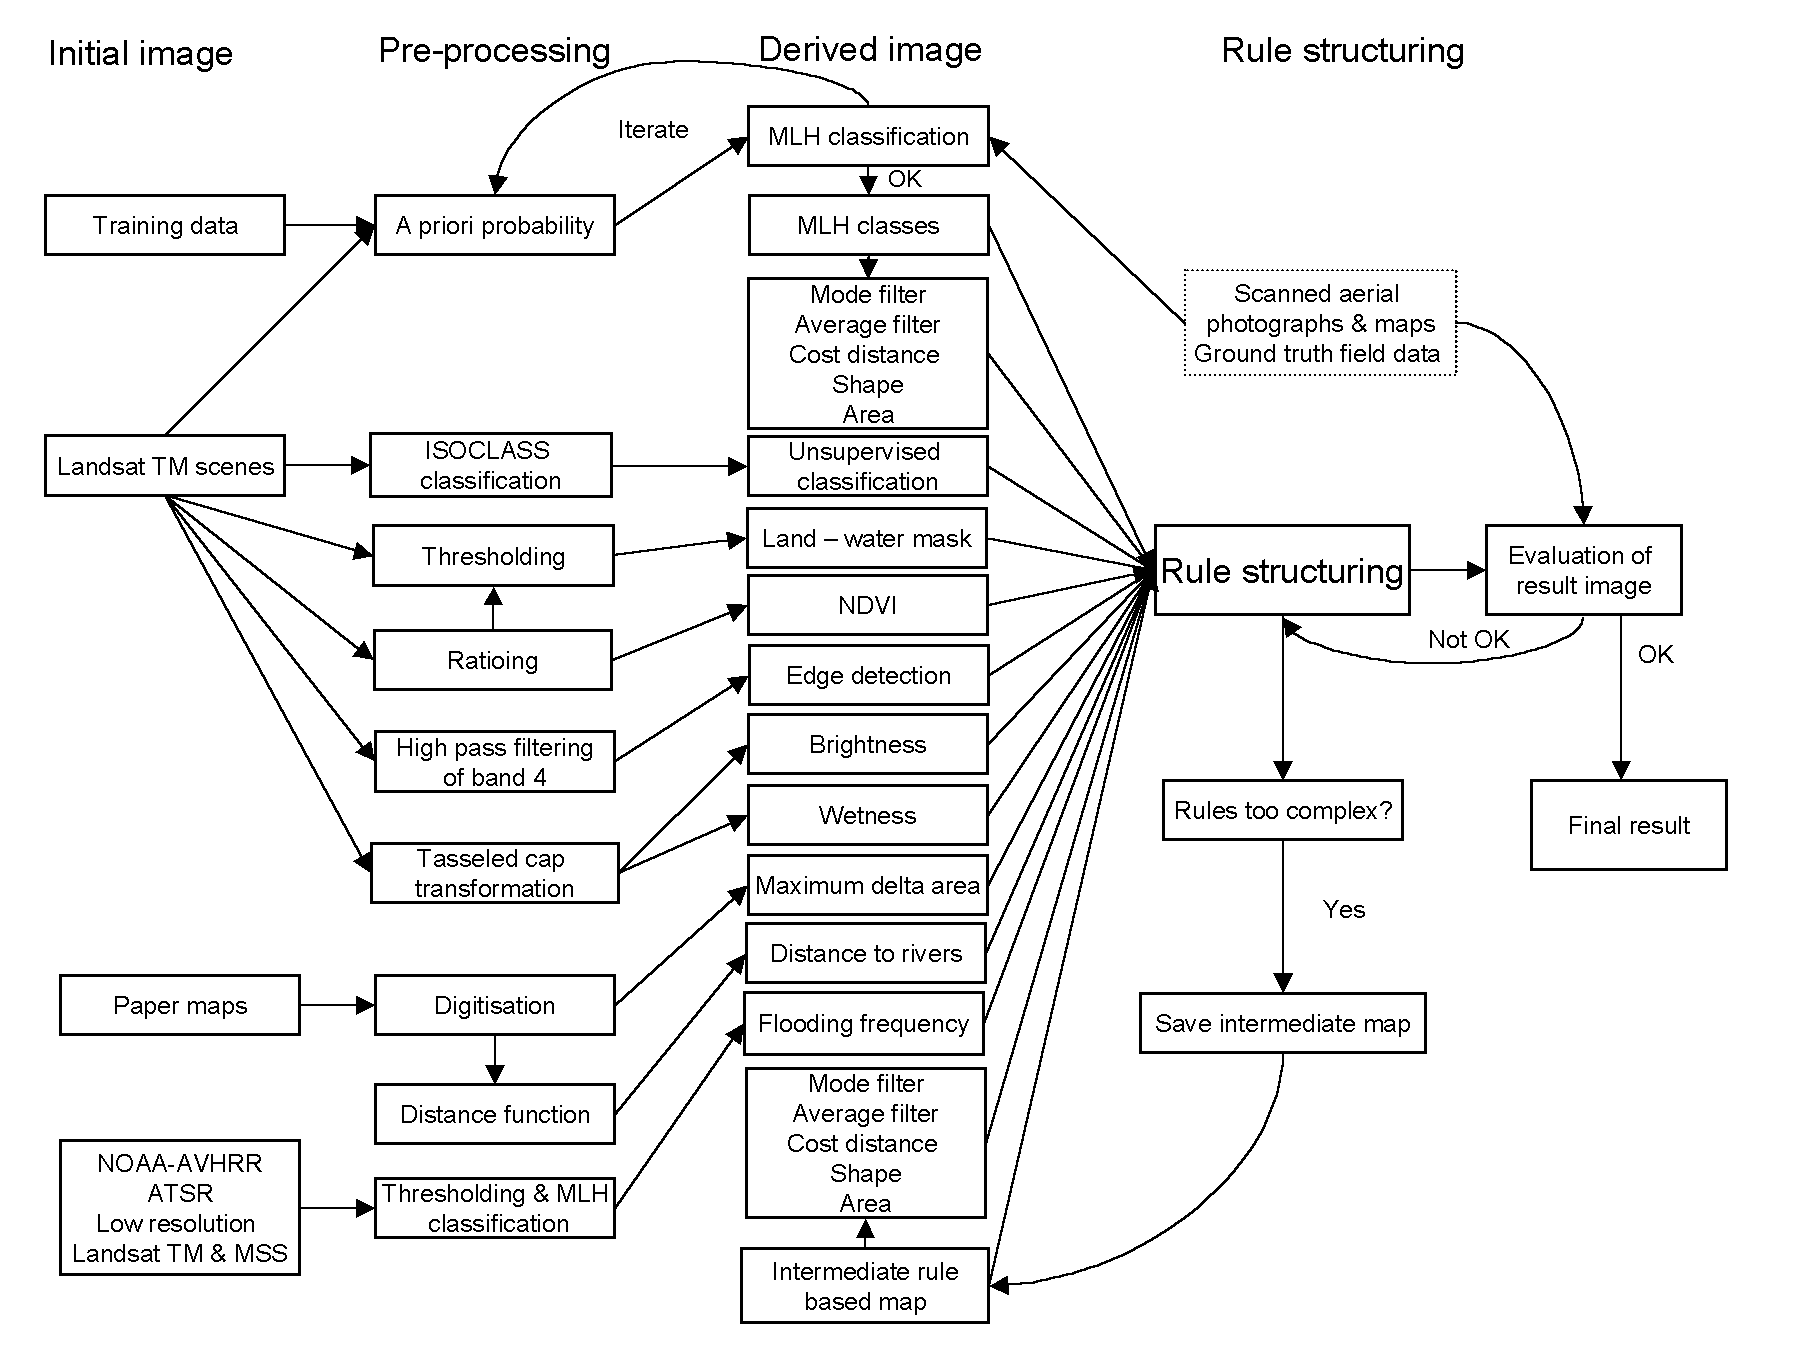
The classification was done using both high resolution Landsat images and moderate to low resolution time series of ATSR, Landsat and NOAA-AVHRR images. The latter images were only used for determining the flooding pattern (as shown in figure 3). Some of the 12 classes above have identical spectral properties and can not be distinguished in single scenes (e.g. the Landsat images). The categorization between different types of grasslands and pans (i.e. between i) flooded, ii) occasionally flooded or iii) dry) were done using the flooding frequency. Figure 4 illustrates the different ecoregions used in the classification, with the color code bar corresponding to the colors in the ecoregion map.

Earth observing satellites have during the last decades become a powerful tool for portraying the earth’s surface. Commercial satellite pictures down to metre resolution are now becoming globally available. Ideally the resolution (or grain size) on a satellite image should correspond with the structures on the ground that are to be identified. Apart from the grain size, also the spectral resolution is important. For identifying and classifying the ecoregions of the Okavango we used Landsat Thematic Mapper (TM) data. This data has a resolution of 30 metres, and is spectrally resolved into blue, green, red, infrared (three spectral bands) and thermal infrared (temperature). To cover all of Okavango, four images had to be pasted together (figure 1).
The pasted satellite images with seven spectral bands were used for classifying the Okavango and its surroundings into 12 ecoregions. After many trials and as many errors, we decided on using an approach that combined the spectral information with known logical relations of spatial patterns. The classification procedure started with identifying the “colours” and “temperatures” of different sites that we had visited in the field. Hence we knew the spectral properties (or signals as the jargon goes) of for example water, papyrus, reed, sedges, grassland, riparian forest, salt crust, mopane and acacia woodland, to name a few. Knowing the signals we let the computer look for areas with similar spectral properties and assigned them to the corresponding class. As the Okavango is very large this did not work out that well, and it also turned out that papyrus and reed had very similar spectral properties to trees. This happens because the papyrus and reed is so dense that no water is seen when looked upon from above. Another obvious problem was water inundation in the seasonal swamp, disclosing the dominating vegetation from being detected. These errors could all be resolved by adopting time series of more coarse satellite images. From 1 km resolution images we derived a general flooding pattern. Hence we could say that papyrus identified outside the permanently flooded region was erroneous, and probably should be classified as dry woodland instead. And vice versa. We could also distinguish between permanent and seasonal swamps, even if the inundation in the Landsat TM data prevented us from “seeing” below the water-surface present at the particular time that image was acquired. We also encountered a lot of problems with classifying small-scale structures in the Delta itself. Many islands are only around 30 x 30 metres, or one picture element (pixel) in size. And as mentioned, differentiating between papyrus and trees was difficult. However, the occurrence of a salt pan or salt crust indicates that the likelihood of a nearby trees is high. (The trees transpirate more, and hence give rise to saline ground water). It is also unlikely that papyrus or reed grow very far from a channel, or in the middle of an island. This kind of small scale, neighborhood information was used for improving the classification accuracy in the permanent and seasonal swamp regions. The final classification was hence based on more than 50 data sources, including the seven Landsat bands, the initial classification, degree of membership for each pixel with different signals, neighborhood properties, flooding frequencies, and many more. This information was combined in an expert system of the type “If ….. then ….. else ….”. An expert rule for papyrus could hence look something like “If classified as papyrus or tree, and permanently flooded, and close to channel, and far from salt crust, and surrounded by other wetland classes then papyrus else ….”. Figure 5 summarizes the methodological approach
Results
The final map contains 12 ecoregions. This map was simplified into versions with 11 and 6 classes respectively for improved readability and also for improved accuracy. The map in six classes is accurate to 75 %, whereas the 12-class map is accurate to 63 %. Around half the errors is dependent on generalisations in the data, and on small scale (up to approximately 200 metres) inaccuracies in the geometry of the satellite images compared to the ground.
Full resolution GeoTiff layer
The full resolution (28.5 m resolution) ecoregion classification is available as a GeoTiff image. The downloadable GeoTiff is projected to UTM34S (EPSG:32734), and available as a zip file. Note, that the data has been reprojected to the standard UTM projection using WGS84, not the Cape datum as in the original study.
Print ready small (A4) map
print ready large (A0) poster map
The full resolution poster is available here.
Resources
GitHub folder with GeoTiff of ecoregion classification
Acknowledgement
The classification work was done as part on an international co-operation within the Okavango Research Group headed by prof. T.S.McCarthy, Department of Geology, Wits University. Financing came through a scholarship from the The Swedish Foundation for International Cooperation in Research and Higher Education for doctoral student Jenny McCarthy and as a post doctoral scholarship financed by the Swedish Royal Academy of Sciences, for the author.