
Understanding the Okavango swamps in Botswana requires knowledge on both the seasonal and inter-annual variations in inundation (flooding). During my Post Doc period (1999-2001) at University of the Witwatersrand in Johannesburg, South Africa, we acquired a series of different coarse resolution image data sets, including from several generations of the Advanced Very High Resolution Radiometer (AVHRR) operated by the US National Oceanic and Atmospheric Administration (NOAA), the European Space Agency (ESA) Along Track Scanning Radiometer (ATSR), and low resolution (quicklook) Landsat images. As noted in the previous post, this was before the release of free Landsat images and we used the quicklooks available on internet (intended for “window shopping”). Primarily these datasets were used for mapping the flooding dynamics of the Okavango swamps.
Details on the methods for processing the data presented (and made available for download) are available in a scientific article published in the journal Ambio:
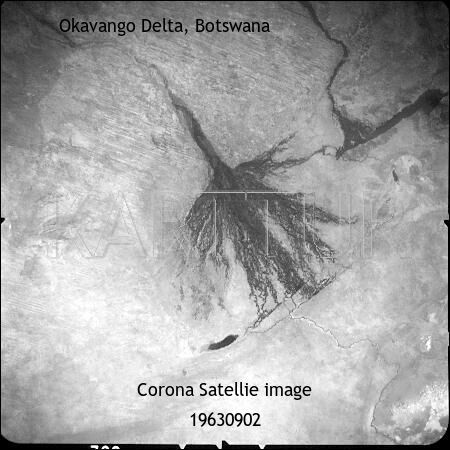
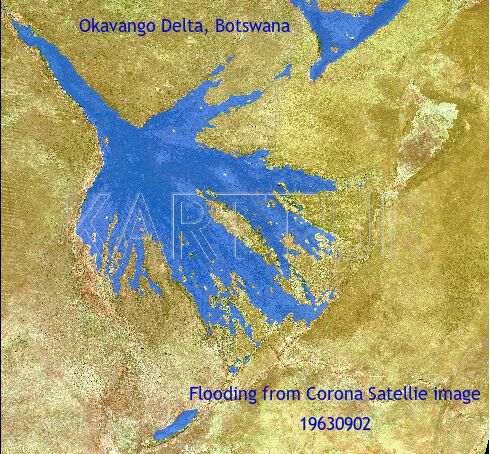
The earliest image and the largest flood
The largest flood I have found occurred in 1963. This is a decade before the first Landsat satellite was put into orbit, but the flood was captured by a Corona (US spy) satellite. Figure 1 shows the full Corona image, along side a flood mask that I created from the image.
AVHRR
We had two different sources of AVHRR images. Via the USAid Famine Early Warning System (FEWS) 10-day composites of AVHRR data over the whole of Africa were freely available for 1992, 1993 and 1995. And then the South African Institute for Soil, Climate and Water had stored AVHRR images over southern Africa starting in 1985. The latter were the main source of the data in the Ambio article; other data sources could almost be seen as supplementary.
AVHRR 1985-2000
In total we got access to 2951 AVHRR scenes from the Institute for Soil, Climate and Water for the period 1985 to 2000. In a first step we reprojected these to SUTM 34 and masked out all clouds. If you are interested in these images, please drop me an email. They are copyright protected, and I can not share them freely.
From the 2951 scenes we selected the best 381 and applied a clustering classification with manual selection of flooded areas (see figure 7 for a summary of the method). A three-dimensional contextual and weighted filter – using the preceding and following images as the third dimension, smoothed the initial water classification. Pixel locations with clouds were handled by seeking the closest cloud-free image for that pixel. In total we created complete flooding maps for 373 dates. The GeoTiff files for these dates are available for download here
From the set of 373 images of composed dates we estimated the flooding for 152 months between February 1985 and December 2000. The monthly GeoTiff layers at 1 km spatial resolution are available for download in two versions:
In the latter the three months of July, August and September 1993 are missing. The images are boolean masks indicating flooding / non-flooding.
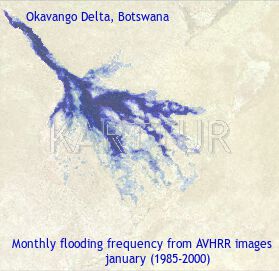
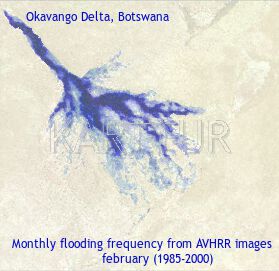
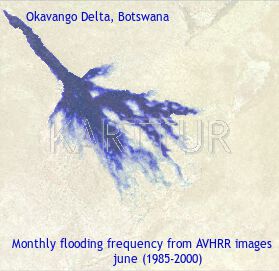
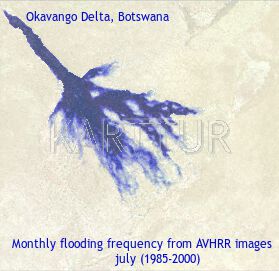
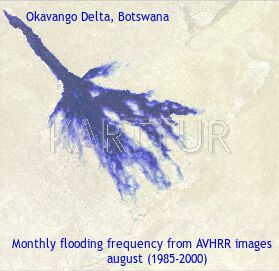
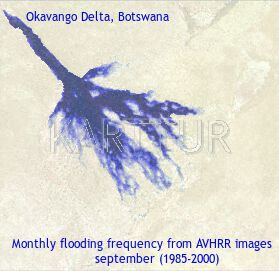
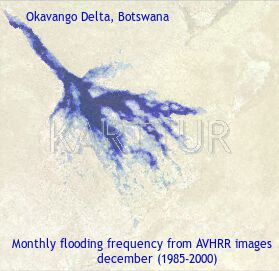
Monthly inundation pattern
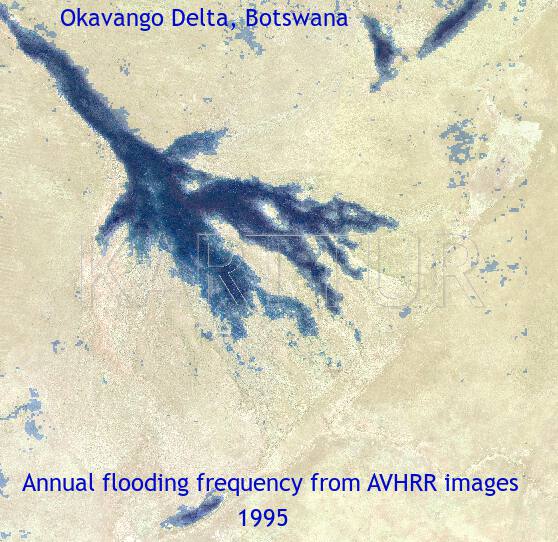
Figure 2 shows the monthly flooding frequencies for the period 1985-2000 based on the monthly images. The monthly frequency GeoTiff layers representing 1985 to 2000 at 1 km spatial resolution are downloadable here. The images are in byte format with the cell value denoting % of time inundated. The frequency images only show the Okavango; Linyanti and Lake Ngami are masked out.


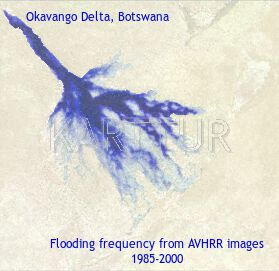
Overall flooding frequency
Figure 3 shows the overall flooding frequency for 1985-2000. The GeoTiff layer at 1 km spatial resolution is downloadable here. The image is in byte format with the cell value denoting % of time inundated. The image only shows the Okavango; Linyanti and Lake Ngami are masked out.
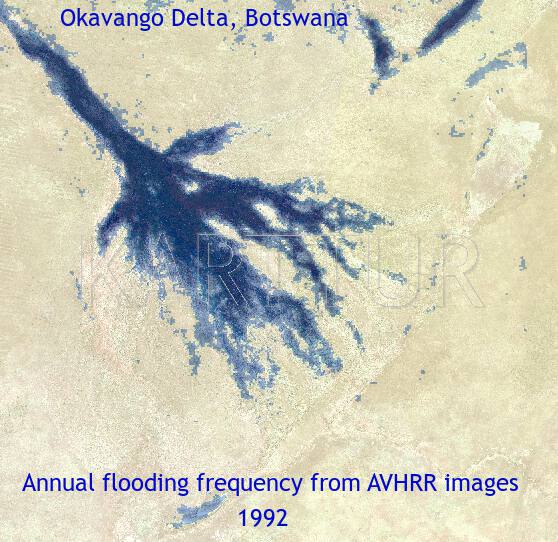
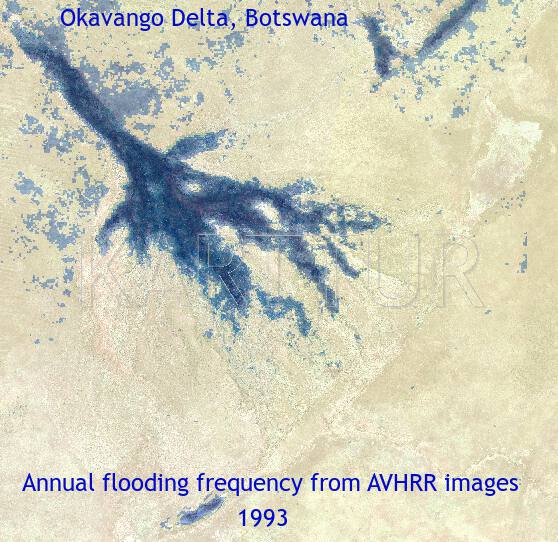
AVHRR 1992, 1993 and 1995
After a long period with relatively larger floods 1960 to 1990 (see figures 1,2 and 5), the early 1990s saw smaller floods in the Okavango. The AVHRR 1992 to 1995 data made available by FEWS (see above) thus show comparatively smaller floods, figure 4. The GeoTiff layers at 1 km spatial resolution are downloadable here. The images are in byte format with the cell value denoting % of time inundated. These images were the first set we got access to and were only used in initial studies.
Landsat quicklooks
From the USGS online archive of available Landsat scenes back in 2000, we grabbed all the quicklooks we could find (totaling 92). Using an automatic clustering routine followed by manual selection of water classes we created water masks for each individual scene (see figure 7). The water masks for all 92 scenes can be downloaded as GeoTiff layers here
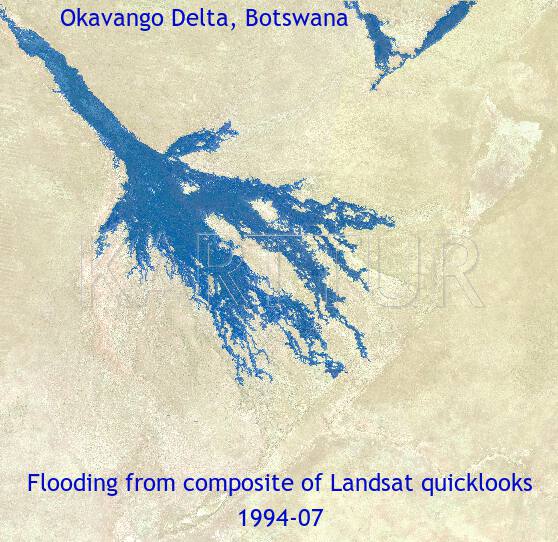
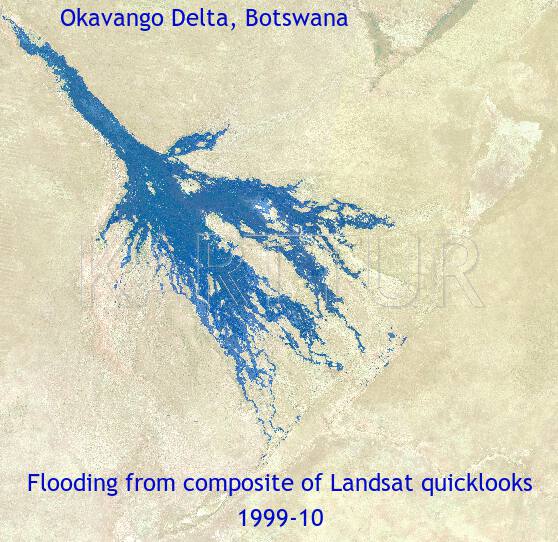
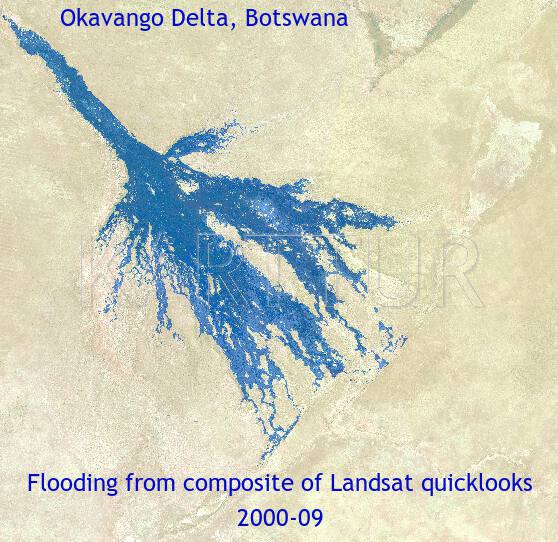
Covering the whole of the Okavango Swamps from Landsat data requires four (4) Landsat scenes (see previous post). For months with complete (or almost complete) coverage over the Okavango, we created monthly inundation masks. Combining all data for an annual cycle we also created images of the maximum annual flood for years with sufficient data.
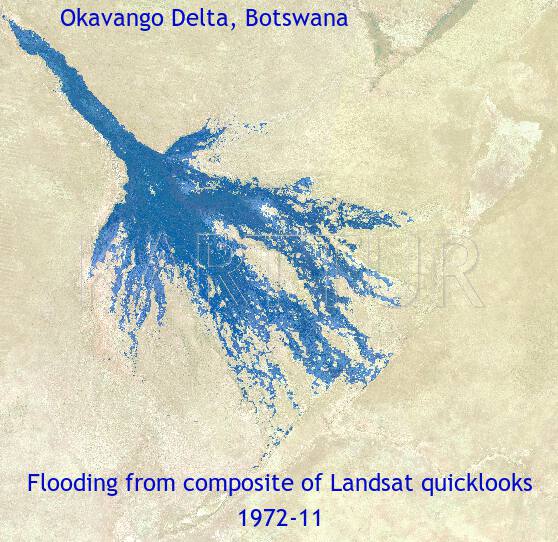
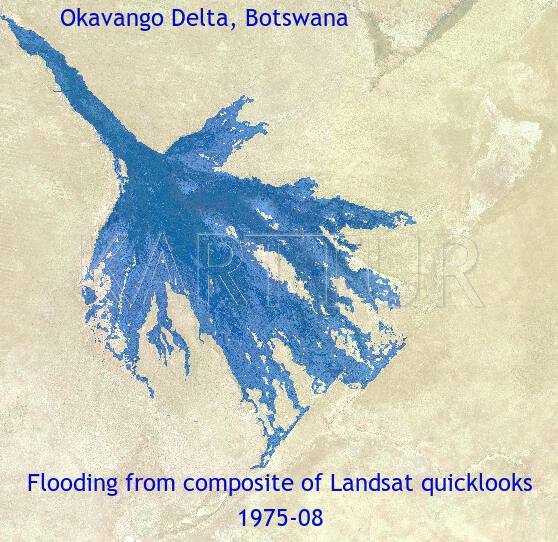
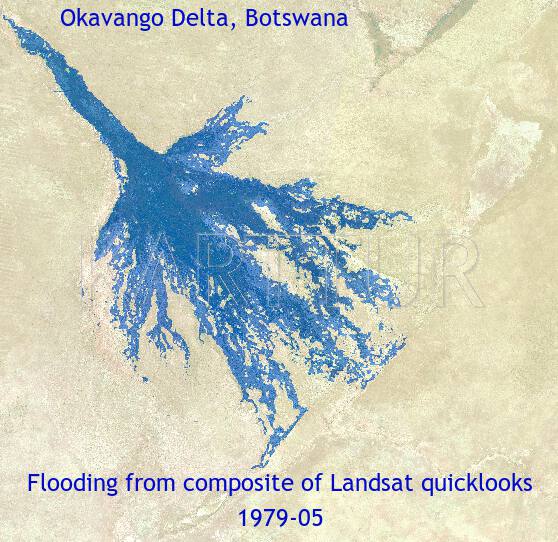
Monthly floodmasks
Figure 5 shows all the complete monthly composite flood masks that we could create from Landsat quicklooks images. The earliest mask is from November 1972. The GeoTiff data are available for download here.
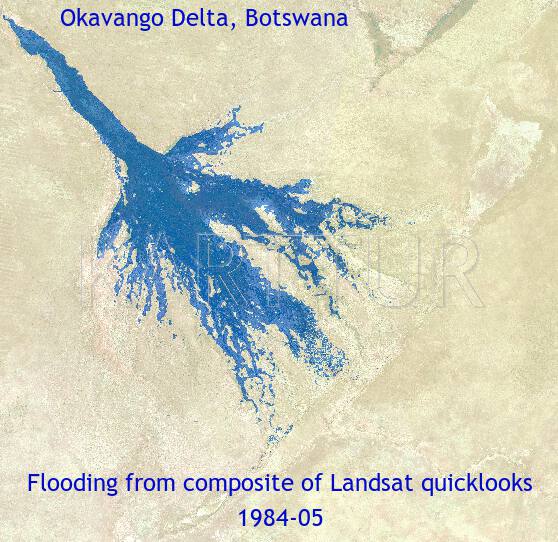
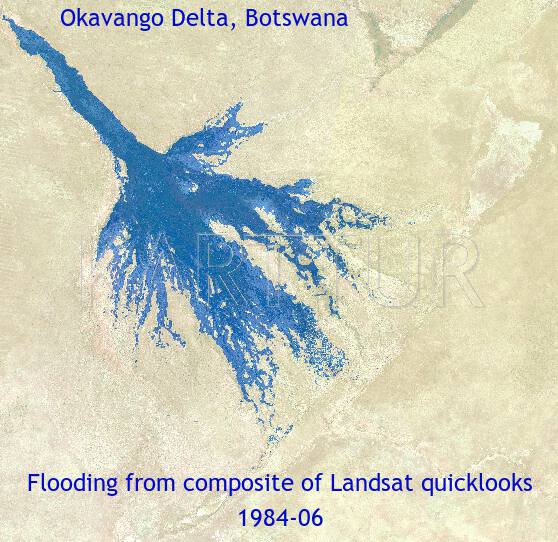
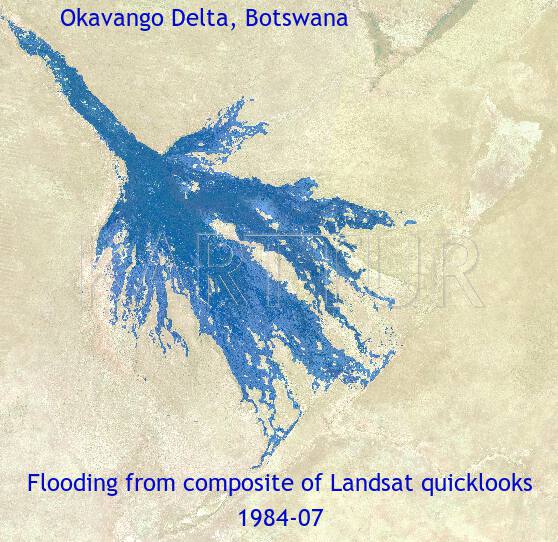
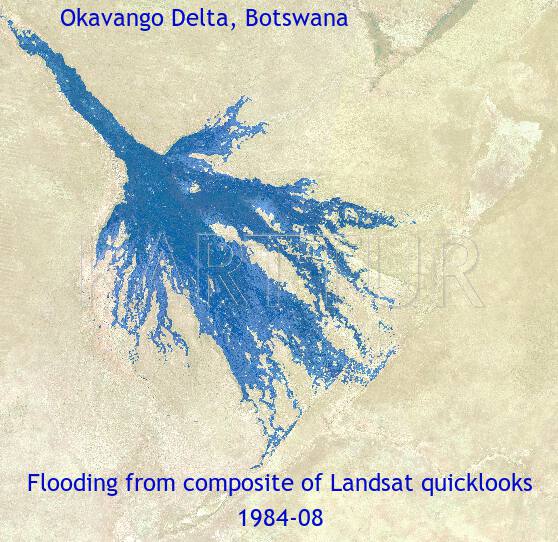


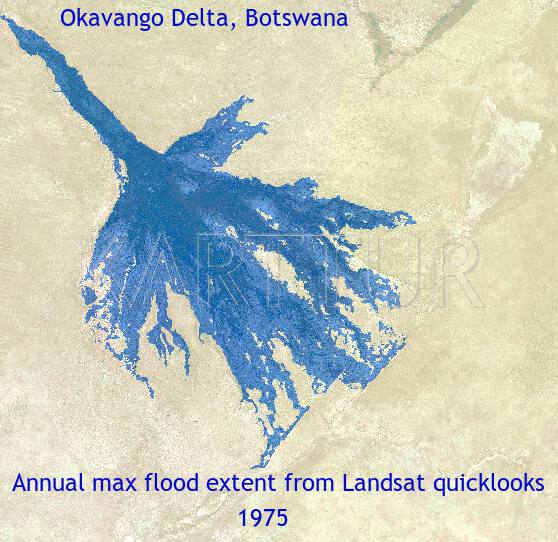
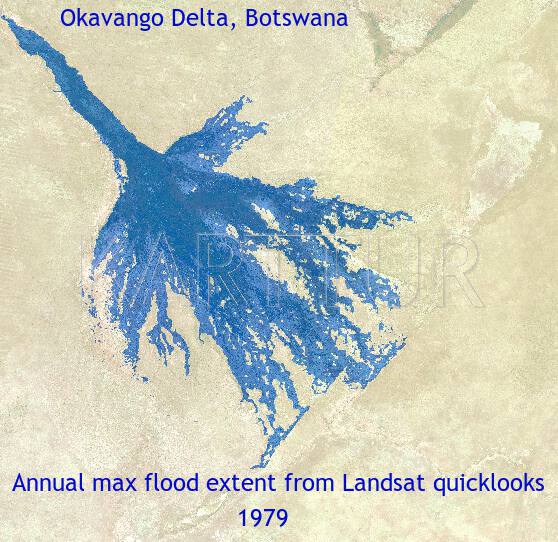
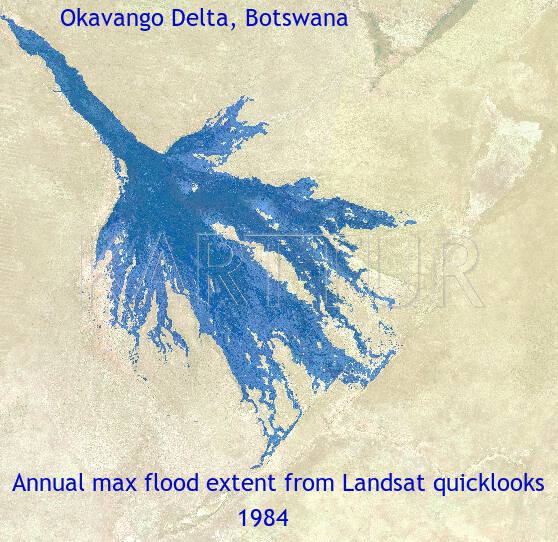
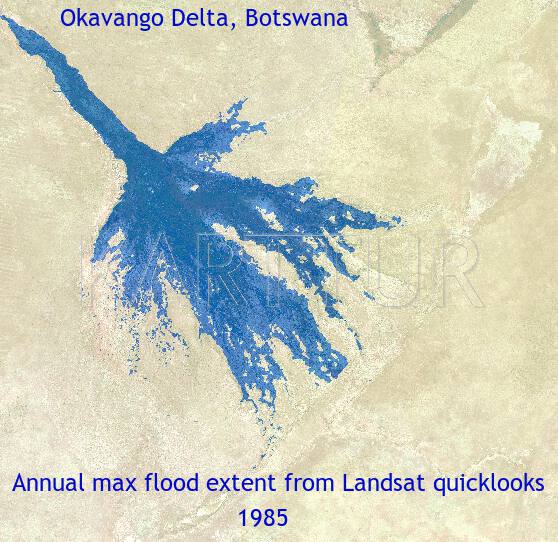
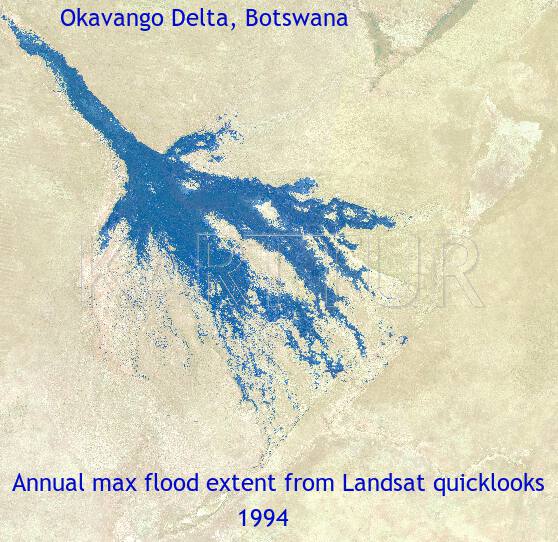
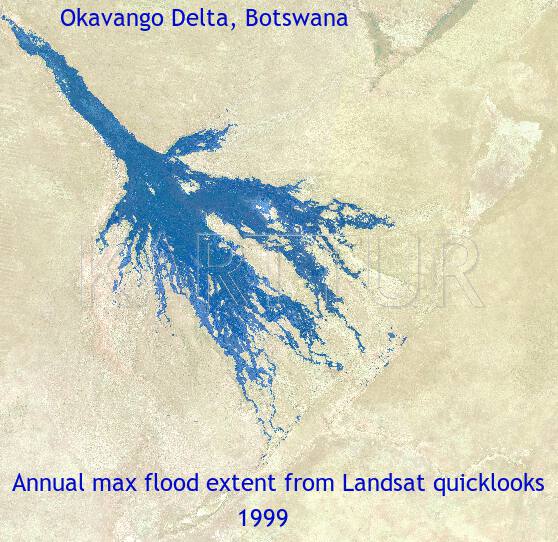
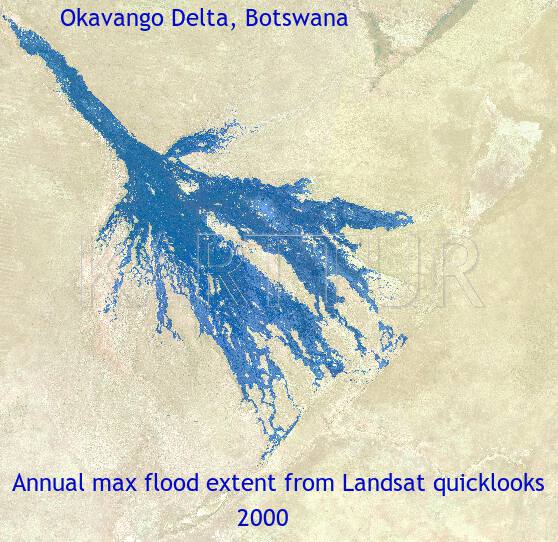
Annual max floods
The annual maximum extent (accumulated) of the inundation area made use of all available Landsat quicklooks, figure 6. (Not only the composites shown in figure 5 where used to construct the maps in figure 6). The GeoTiff data for the annual maximum flood are available for download here.

ATSR
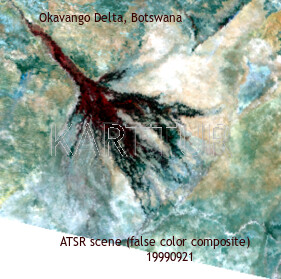
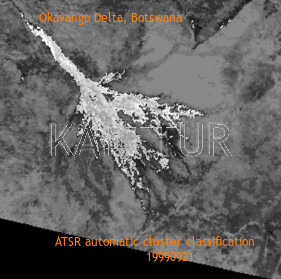
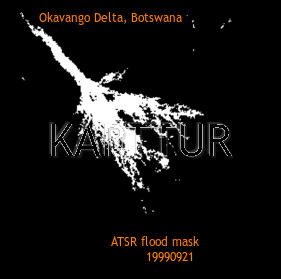
For 1999 and 2000 we acquired 28 ATSR scenes over the Okavango, you can download the raw scenes cut to the Okavango and projected to SUTM 34 at 1 km spatial resolution here. Note that some of the scenes are taken at night.
The ATSR data are of higher quality compared to both Landsat quicklooks and the archived AVHRR data we had access to. We hence used the ATSR for accuracy evaluation of the flood masks created from AVHRR data.
The extraction of inundated areas from the ATSR images followed the same methods as applied to the AVHRR and Landsat quicklooks; from an initial clustering the clusters representing flooding were manually selected and extracted. Figure 7 illustrates the work flow for generating all the flood masks presented here.
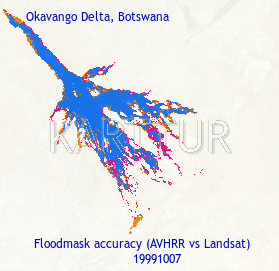
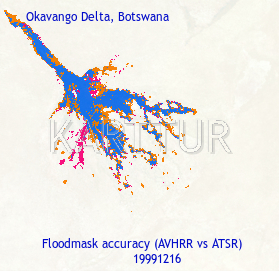
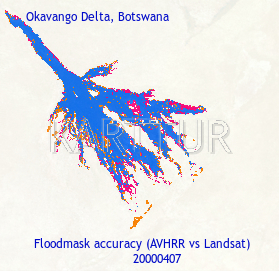
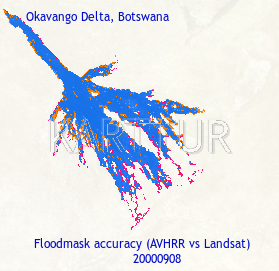
Accuracy evaluation
In total, the accuracy of the flood masks were tested comparing 12 dates. For each of these 12 dates we created flood masks from data representing two different sensors, either AVHRR versus ATSR, or AVHRR versus Landsat. For most of the dates we had to combine data from adjacent dates to create complete and cloud free maps from both sensors. See the article in Ambio for details. The cross correlations indicated an agreement of 89% when comparing the flooding masks from different sensors.
The results for all compared dates are shown in Figure 8.
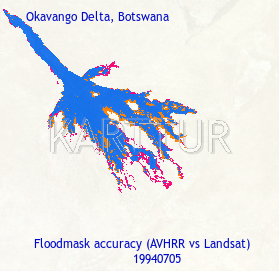
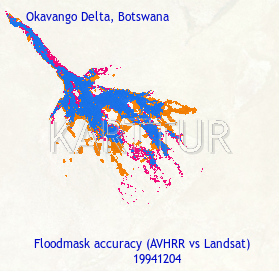
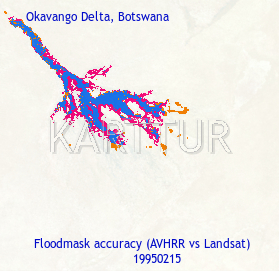

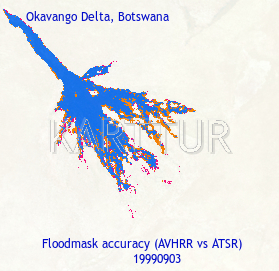
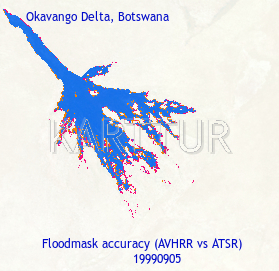
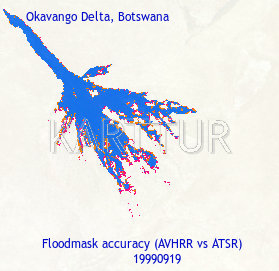
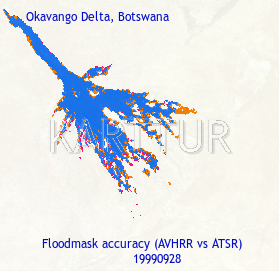
The cross correlation maps above are available for download as GeoTiff files here. Note that the data used in the correlations have been massaged to:
- have the same projection and resolution,
- completely cover the Okavango, and
- only show the Okavango swamps, excluding Linyanti swamps and Lake Ngami.
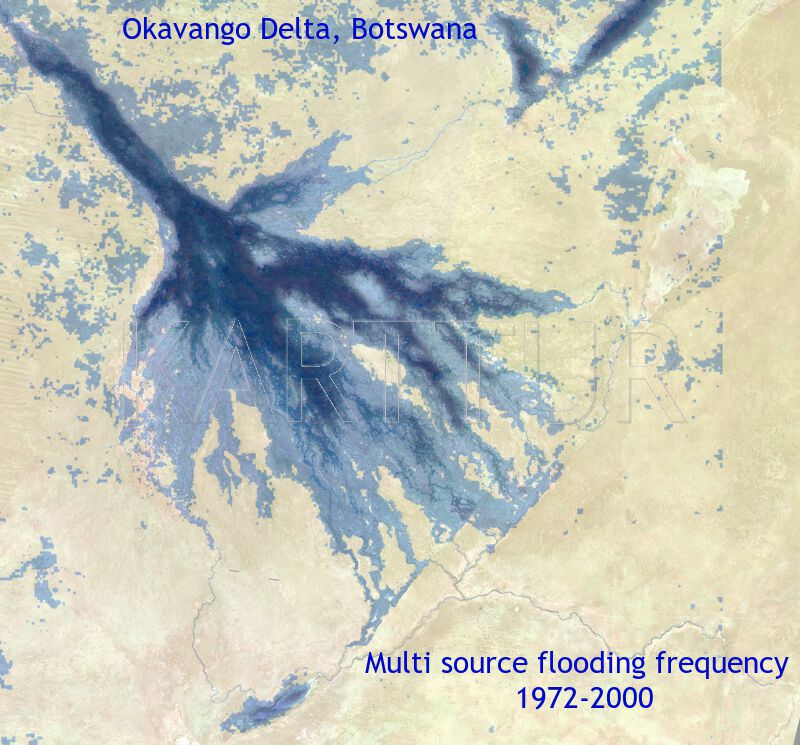
Flood frequency at high spatial resolution
For the mapping and modeling that I wanted to do for the Okavango I needed a higher resolution flood frequency map compared to the 500 m to 1 km spatial resolution of the AVHRR and Landsat quicklooks. To achieve that I combined the flood frequency maps above with the high resolution Landsat scenes that we had received from Anglo American. I then also digitized the river channels in the Okavango swamps and added data on the average flow and flow duration that I got access to. Combining all these sources I then constructed a flood frequency map at 28.5 m spatial resolution, exactly fitting the Landsat composition over the entire Okavango Delta. These two data sources were then the key resources for creating the ecoregion map of the Okavango Delta, the subject of another post.
The full (28.5) resolution flood frequency map over the Okavango is available as a compressed GeoTiff here. The map is projected to SUTM 34, and fits exactly with the Landsat composition and the land cover classification, each presented in other posts. Rather than cleaning the high resolution dataset I kept the suspected overestimations outside the actually swamp area. In the subsequent processing I masked out wetlands.
Studies using the flood data
The flooding data presented in this post were used as input in several other studies. I hope to present these studies in some detail on this blog, in the meantime I supply this list:
- McCarthy, J., Gumbricht, T., McCarthy, T. Frost, P. Wessels, K. & Seidel, K., 2003. Flooding Patterns of the Okavango Wetland in Botswana between 1972 and 2000. AMBIO: A Journal of the Human Environment, 32 (7) , 453-457.
- Bauer, P., Gumbricht, T., & Kinzelbach, W., 2006. A regional coupled surface water/groundwater model of the Okavango Delta, Botswana Water Resources Research, 42 (4) , 1-15.
- Wolski, P., Savenije, H.H.G., Murray-Hudson, M & Gumbricht, T., 2006. Modelling of the flooding in the Okavango Delta, Botswana, using a hybrid reservoir-GIS model. Journal of Hydrology, 331 (1-2) , 58–72.
- McCarthy, J., Gumbricht, T., & McCarthy, T. S., 2005. Ecoregion classification in the Okavango Delta, Botswana from multitemporal remote sensing. Int J Remote Sensing, 26 (19) , 4339–4357.
- Gumbricht, T., Wolski, P., Frost, P. & McCarthy, T.S., 2004. Forecasting the spatial extent of the annual flood in the Okavango delta, Botswana. Journal of Hydrology, 290 (3-4) , 178–191.