This post steps through how to order, download, import and process global precipitation data from the Tropical Rainfall Measurement Mission (TRMM) into Karttur´s GeoImagine Framework.
The Tropical Rainfall Measurement Mission (TRMM) ran for more than 20 years (from 1998 to 2019, even though the radar ceased to function already in October 2014). The monthly precipitation product, TRMM 3B43 developed from TRMM also makes use of other satellite borne precipitation estimates as well as ground based measurements. The product thus continues, despite that the TRMM instrument is no longer operational. The multi-satellite 3B42 product will continue to be produced through mid 2019, and then be replaced by IMERG.
This blog summarises how to process TRMM using Karttur´s GeoImagine Framework. There is no particular TRMM package, the TRMM data is instead handled as ancillary data.
Accessing and downloading the TRMM data is not done as part of Karttur´s GeoImagine Framework as the data have to be ordered and then downloaded. The next section gives some options for downloading TRMM data.
STORM (https://storm.pps.eosdis.nasa.gov/storm/) is NASA’s web interface for publicly available data from the Global Precipitation Measurement (GPM) Mission’s Precipitation Processing System (PPS). TRMM is included, along with a lot of other data.
To access the TRMM 3B43 product, click the PPS Data Access link on the STORM front page. You must be registered to access the data. When registered, just give your Email, and then search and define the data you want to access (e.g. TRMM 3B43). Select the all TRMM granules (248 months of data at time of writing). Then select the type of script you want for downloading, FTP script, FTP URL or Python. Submit the request. You will receive an email with instructions on how to access the ordered data.
To avoid duplicate downloading I use the Python script, and move it to my folder where I store the original data. I then run the script from that folder, and the script will recognize any duplicate and skip re-downloading.
Mirador
You can also get the data via Mirador with this direct link. The data access page should automatically choose the monthly dataset (3B43) that is used in this tutorial. Simply select all months for all years, add them to your “shopping basket” and you will get a complete list of the http links.
Access EarthData server
Trying to retrieve the hdf files in the list, it turns out that the files have been transferred to a secure server, and the “http” is changed to “https”. The data now resides on the server http://disc2.gesdisc.eosdis.nasa.gov. To access the data on that server you need to register at Earthdata.
With 20+ years worth of rainfall maps, manual download would take a very long time. Instructions for how to set up wget or curl for downloading data from GES DISC is found here, and summarised for mac osx below.
Create .netrc server access
For automatic login and to the GES DISC server you need to enter the server, your login and password in a .netrc file. The .netrc can be placed in any folder, but unless you put it in your home directory you have to give the path. I put mine in my home directory. Open a Terminal window. To make sure you are in your home directory change directory (cd) in a terminal window:
cd ~
Then use the sudo command and a terminal text editor (for example pico) to create/open your .netrc file:
sudo pico .netrc
Add the line with the machine, login and password to the .netrc file:
Exit pico (ctrl + X) and save the edited .netrc file. Change the access to .netrc so that it can be opened by the wget command:
chmod 0600 .netrc
Then you also need to create a cookie file (in your home directory) called .urs_cookies. It will be empty at start, and you can create it either using pico or the terminal command touch:
touch .urs_cookies
To transfer you credentials from .netrc to .urs_cookies you have to run wget, and (perhaps) give you login and password. While still in the Terminal window, just do a wget for the file used in the EarthData manual for setting up wget
On the EarthData How To manual page for setting up wget different options for listing and downloading data are given. But I choose to write a small Python script for better control, also avoiding downloading files that I already have on my local system. I already got the list of all the files I want to download from the Mirador server, and I will use that list to step through all files.
import os

def WgetErthDataTRMM(srcFPN, dstFP):
    if not os.path.exists(dstFP):
        os.makedirs(dstFP)
    for line in open(srcFPN):
        url = line.strip()
        FN = os.path.split(url)[1]
        dstFPN = os.path.join(dstFP, FN)
        if not os.path.exists(dstFPN):
            if not 'https' in url:
                url = url.replace('http','https')
            cmd = '/usr/local/bin/wget --load-cookies ~/.urs_cookies --save-cookies ~/.urs_cookies --keep-session-cookies --directory-prefix=%(dst)s %(url)s' %{'dst': dstFP, 'url':url}
            os.system(cmd)
        else:
            print ('already done', FN)

if __name__ == "__main__":
    srcFPN = '/Path/To/List/With/urls/url_trmm3B43v7_trmm_1998-2017.txt'
    trmmFP = '/Path/To/Destination/Folder'
    WgetErthDataTRMM(srcFPN, trmmFP)
The script opens the file (from Mirador) that lists all the urls (server side files) that I want to download. The script then changes “http” to “http” and creates the wget command (cmd) for downloading, including setting the cookies file with your credentials, and then also steers the download to the destination folder. If the file already exists in the destination folder, it is not downloaded again.
Project module
Other processing of TRMM data is done from within Karttur’s GeoImagine Framework. The project module file (projTRMM.py) is available in the project package projects.
from geoimagine.kartturmain.readXMLprocesses import ReadXMLProcesses, RunProcesses

if __name__ == "__main__":

    verbose = True

    projFN ='doc/TRMM/TRMM_YYYYMMDD.txt'

    procLL = ReadXMLProcesses(projFN,verbose)

    RunProcesses(procLL,verbose)
Process chain
The project file links to an ASCII text file that contains a list of the xml files to execute.
projFN ='doc/TRMM/TRMM_YYYYMMDD.txt'
As the path to the project file does not start with a slash “\”, the path must be relative to the project module itself. The project package available on Karttur’s GitHub page contains the path and the files required for running the process chain. Both the text file and the xml files are available under the subfolder doc/TRMM.
###################################
###################################
###             TRMM            ###
###################################
###################################

###################################
###          Update db          ###
###################################

## If you have access to TRMM data created by karttur's Geoimagine Framework ##
## you can access the data from your Framework installation by updating the db ##
#TRMM-0190_udatedb.xml

#If the above process is run the next setcion "Import" can be skipped.

###################################
###            Import           ###
###################################

## Import the 1998 to 1999 data (separate naming) ##
#TRMM-0100_ancillary-import-3B43v7_1998-1999.xml

## Import the 2000 to 2010 data (separate naming) ##
#TRMM-0100_ancillary-import-3B43v7_2000-2010.xml

## Import the 2010 to 2018 data (separate naming) ##
#TRMM-0100_ancillary-import-3B43v7_2010-2018.xml

## mend TRMM (fill in nodata holes and negative numbers) ##
#TRMM-0110_mendts.xml

## Rename, fix the date stamp and copy the cleaned TRMM data ready for use ##
#TRMM-0120_monthdaytomonth.xml

###################################
###   Time Series Processing    ###
###################################

## Resample TRMM to annual ##
#TRMM-0290_resample-2-annual.xml

## Estimate TRMM annual trends (1998-2017 is for the complete timeseries, 2003-2016 for overlap with GRACE ##
#TRMM-0310_trend_A_1998-2017.xml
#TRMM-0310_trend_A_2003-2016.xml
#TRMM-0310_trend_A_2001-2017.xml

## Identify regions with significant trends (1998-2017 is for the complete timeseries, 2003-2016 for overlap with GRACE ##
#TRMM-0320_changes_A_1998-2017.xml
#TRMM-0320_changes_A_2003-2016.xml
TRMM-0320_changes_A_2001-2017.xml

## Decompose TRMM timeseries ##
#TRMM-0360_decompose_M.xml

## Autocorrelation ##
#TRMM-0370_autocorr_M.xml

## Cross correlation between monthly climate indexes and TRMM  ##
#TRMM-0380_index-x-corr_M.xml
Import
If you have access to TRMM data already processed with Karttur’s GeoImagine Framework you can import the data using the process updatedb. In the example below, the preprocessed monthly TRMM data is imported:
To import and prepare the data from downloaded .hdf files, you have to extract, mend (fill in nodata) and rename the TRMM as outlined below.
Extract TRMM hdf data
Karttur’s GeoImagine Framework has a special process for extracting and importing the data layers from the TRMM .hdf files. The process uses a combination of GDAL and numpy for rearranging the layers in the TRMM files on the fly. The core GDAL call for extracting the TRMM data is:
Because the file naming of the TRMM 3B43 product is different for the period 2000 - 2010 compared to dates before and after, you have to create 3 separate xml files for importing the complete dataset (1998-1999, 2000-2010 and 2011-2017).
In the example xml the TRMM data are extracted to a separate folder “rainfall-original”, because a few dates include nodata, and I wanted to get rid of them as explained in the next section.
The process loads the complete dataset and checks the complete time series one cell at the time. Any nodata is replaced by the interpolated values from adjacent dates.
Renaming and editing the date format
The original TRMM data have filenames that include the date of acquisition, but with the month represented by the first day of the month. In Karttur´s GeoImaginge Framework, data representing a month is denoted by year + month (YYYYMM). The Framework code for this date format is “M” (or “MS” in agreement with the Pandas coding). (The Framework, however, can use the first day of each month for representing monthly data, with the code “montlhyday”).
To change the date format YYYYMMDD (“monthlyday”) to YYYYMM (“M”), run the process MonthlyDayToMonthlyAncillary:
The TRMM product that is used here, 3B43, represents monthly time steps. For trend analysis you are going to use annual data, and you must thus first resample, or sum up, the monthly data. This is done with the process resampletsancillary:
From the annual data of summed precipitation, calculate the trend using both Ordinary Least Square (OLS) regression, and Theil-Sen regression along with a Mann-Kendall test using the processes trendtsancillary (see the GRACE post for details).
You can calculate the trend for any period; the example under the Hide/Show button is for the period 1998-2017. If you want to compare the precipitation trend with trends in Gravity observed water pillar (from GRACE) or MODIS derived soil moisture, you need to calculate trends for the time-period (years) overlapping with these other datasets (e.g 2003-2016 for GRACE).
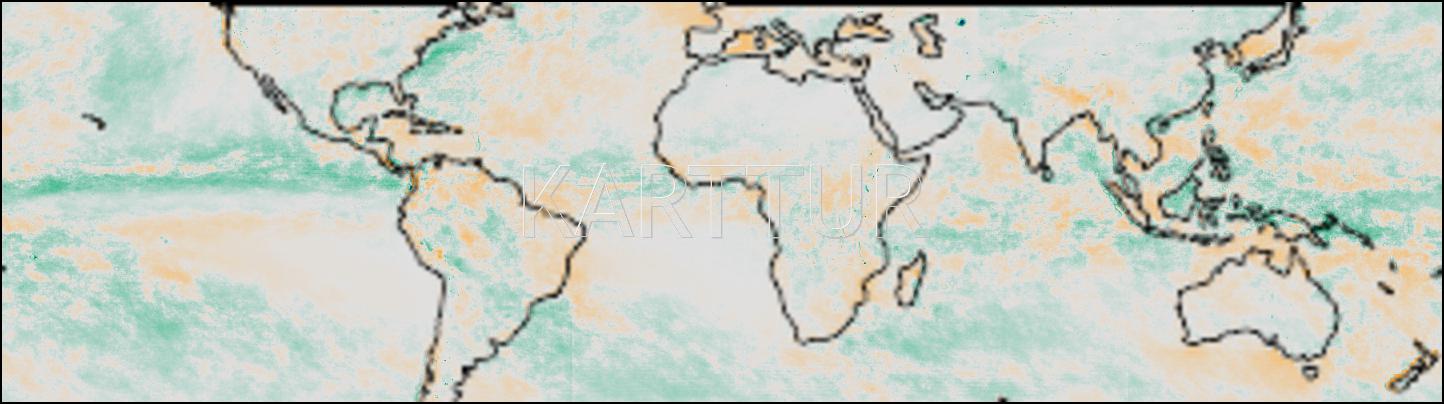
Maps of global rainfall; the panels shows the average annual rainfall (mm) 1998 to 2017 and the the annual trend (mm/yr) (Theil Sen) for the same period.
Analyse precipitation changes
You can use the results from the analysis of precipitation trends to identify regions where the change has been significant, and how strong the changes have been. The process for that is signiftrendsancillary.