Introduction
The landform of a particular landscape is both dependent on the field-specific spatial scale at which the landform is portrayed, as well as the local lithology and elevation profile (e.g. steep, gentle or flat). Landform mapping from Digital Elevation Models (DEMs) usually focus on restricted regions and adopts a local field-specific kernel approach, with site and scale specific definitions of the landform classes. Mapping global landforms at a moderate resolution scale demands a more generic approach compared to traditional landform maps.
Overview
This post deals with landform classification fromTerrain Position Index (TPI) data.
Landform classification from TPI
The TPI based landform classification included in Karttur’s GeoImagine Framework follows the multi-scale TPI suggested by (Weiss, 2001):
TPI = Zgrid – focalmean(Zgrid,cicle,r)
where Zgrid is the cell of the DEM. focalmean is the mean DEM value within the circle of radius r centering on the cell. By using TPI derived from two (or more) hierarchical scales, a fairly simple set of rules can be used for classifying any landscape in 10 more basic classes (table 1).
Table 1. Landform classification from twin-scaled TPI data, where TPIS represent the finer spatila scale and TPIL the coarser spatial scale. TPIth is an arbitrary TPI threshold and sth is a slope (sl) threshold.
| TPIS | ||||
|---|---|---|---|---|
| Depressed (-TPIth>=TPIS) |
Planar (-TPITH<TPIS<TPIth) |
Elevated (TPIS>=TPIth) |
||
| Depressed (-TPIth>=TPIL) |
Canyon | U-shaped valley | Local ridge | |
| TPIL | Planar (-TPIth<TPIL<TPIth) |
Shallow valley (sl<sth) midslope drainage (sl>=sth) |
plain (sl<sth) open slope (sl>=sth) |
valley hill (sl<sth) midslope ridge (sl>=sth) |
| Elevated (TPIL>=TPIth) |
upland drainage | dome, mesa | Hill top |
In Karttur’s GeoImagine Framework the default landform classification from multi-scaled TPI data produces 10 or 12 categories:
- 5 Canyon
- 6 Shallow valleys (incl Midslope drainage)
- 7 Midslope drainage (optional)
- 8 Upland drainage
- 9 U-shaped valleys
- 10 Open slope
- 11 Plain
- 12 Dome, mesa
- 13 Local ridge
- 14 Valley hill (incl Midslope ridge)
- 15 Midslope ridge (optional)
- 16 Hilltop, Mountain peak
The numbering and labelling differs compared to Weiss (2001, 2001) original suggestion. In the Framework the original categories “Shallow valleys and Midslope drainage” and “Valley hill and Midslope ridge” can both be separated into its two subclasses using slope data (see table 1). The Framework classification numbering also starts with 5 = Canyon. The reason for this is that the landform can be combined with hydrological data, and used for identifying 4 additional classes (Lakes, permanent rivers, intermittent streams and incised rivers). At time of writing the hydrological data is not completed for the Arctic region.
Classification options
As mentioned above, the Framework landform classification from TPI data can be set to either produce 10 or 12 classes. By default the Framework produces 10 classes; to create 12 classes the parameter extended is set to True.
More importantly, the landform classification can either be set to use the raw TPI data, or standardized data. Standardization uses the mean (m) and standard (std) deviation for rescaling different variables to the same scale:
z = (obs-m)/(std)
The way that TPI is defined and applying it over a spatial domain more or less always causes the TPI mean to closely equal zero, regardless of the spatial resolution. TPI standardization can thus be simplified to just divide the individual observation with the sample standard deviation.
If you want to use standardized TPI data for your landform classification you need to set the parameter standardize to True. You then have three options for ow to standardize the data:
- Global standardization
- Relative standardization
- Local standardization
Global Standardization
When the parameter standardize is set to True, two additional parameters will determine how the standardizations is done: tpisstd and tpilstd. By default these two parameters are given global values of 30.0 and 50.0. This will force standardizations of both the fine (TPIS) and coarse (TPIL) scaled TPI inputs:
zTPIS = (TPIS/(30) zTPIL = (TPIL/(50)
The result will be a landform map that ignores the local terrain properties, but adjusts the coarser scaled TPI to be less pronounced.
If you want to generate a completely consistent landform map you should use the global default values for both tpisstd and tpilstd. If you work with a region, like a continent, you could analyse the TPI variation and set both tpisstd and tpilstd to other values.
Relative standardization
The standard deviation for the coarser scale TPI data is usually higher compared to finer scaled TPI data over the same region. The ratio in the standard deviation between finer and coarser scaled TPI data over the same region, however vary greatly across the globe (at least between 0.5 and 3). One option for global landform mapping is to set a global (or regional) value for tpisstd (the finer scaled TPI data), and then calculate the relative tpilstd by comparing the true standard deviations for TPIS and TPIL. To create a relative standardization you set a positive value for tpisstd while setting tpilstd = 0.
The result is a local adjustment of the TPIL range. In general it will be depressed in hilly and mountainous terrain and elevation in more flat and smooth terrain. It is a compromise between applying a global and a local standardization.
Local standardization
If you set the parameter standardize to True and then also set tpisstd = 0 and tpilstd = 0, both TPIS and TPIL will be independently standardized.
This option is useful for generating a single map but is not recommended if you are processing separate maps (tiles) or regions that you later want to mosaic or use in combination.
Parameterization
Apart from the parameters standardize, tpisstd and tpilstd, you can also set the thresholds for defining depressed, planar and elevated surfaces (table 1). The default threshold value for defining the terrain position (tpithreshold) is set at 25.0 and the default slope for defining flat areas (slopethreshold) is set at 3.6 (degrees). These values are set to represent global average values.
The standardization typically produce values (z-scores) with a lower range, but the standardization includes a multiplication factor (50) that fits the default tpithreshold (25.0). Thus you can usually leave the threseholds for both TPI (tpithreshold) and slope (slopethreshold) at their default values.
XML
The xml code below runs the process he LandformTPIModis in default mode, producing landform classification in 10 classes using the raw TPI data for both the fine and coarse TPI.
<?xml version='1.0' encoding='utf-8'?>
<lfarcticdem>
	<userproj userid = 'karttur' projectid = 'karttur-arcticdemext' tractid= 'karttur-arcticdemext' siteid = '*' plotid = '*' system = 'modis'></userproj>
	<period timestep='static'></period>

	<process processid = 'LandformTPIModis' version = '1.3'>

		<parameters></parameters>
		<srcpath volume = "karttur3tb"></srcpath>
		<dstpath volume = "karttur3tb"></dstpath>
		<srccomp>
			<tpi500-dem500 id = 'tpis' source = "NGA-NSF" product = "arcticdem" folder = "dem-tpi" band = "tpi500-dem500" prefix = "tpi500-dem500" suffix = "v30">
			</tpi500-dem500>
			<tpi1500-dem500 id = 'tpim' source = "NGA-NSF" product = "arcticdem" folder = "dem-tpi" band = "tpi1500-dem500" prefix = "tpi1500-dem500" suffix = "v30">
			</tpi1500-dem500>
			<slope-d-dem500 id = 'slope' source = "NGA-NSF" product = "arcticdem" folder = "dem-slope" band = "slope-d-dem500" prefix = "slope-d-dem500" suffix = "v30">
			</slope-d-dem500>
		</srccomp>
		<dstcomp>
			<tpi500-1500 id = 'landform' source = "NGA-NSF" product = "landform" folder = "landform" band = "tpi500-1500" prefix = "tpi500-1500" suffix = "10cl-arcticdemv30">
			</tpi500-1500>
		</dstcomp>
	</process>
</lfarcticdem>
To create a globally consistent landform map you need to set the parameter standardize to True. If the two parameters tpisstd and tpilstd have positive values the classification will use these values for global standardization. You can optionally change these two values to other positive values.
<parameters standardize='True' [tpisstd = '30'] [tpilstd = '50.0']></parameters>
If you set tpilstd = 0 while keeping a positive value for tpisstd, and with standardize set to True, the result will be a relative global landform classification.
<parameters standardize='True' [tpisstd = '30'] tpilstd = '0.0'></parameters>
Finally you can set both tpisstd and tpilstd to 0, which will result in a local standardization.
<parameters standardize='True' tpisstd = '0.0' tpilstd = '0.0'></parameters>
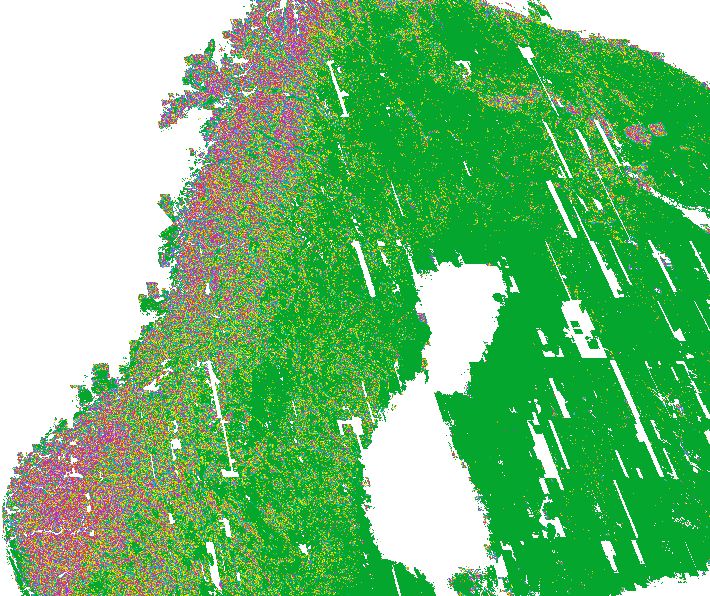
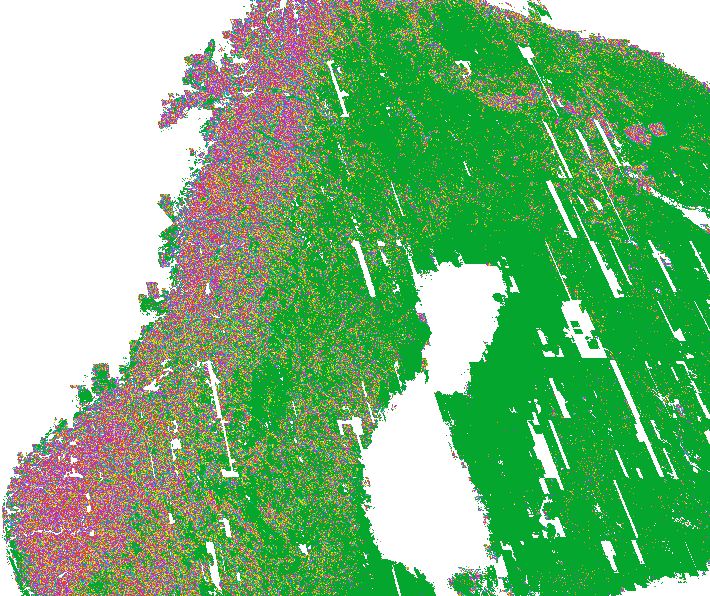
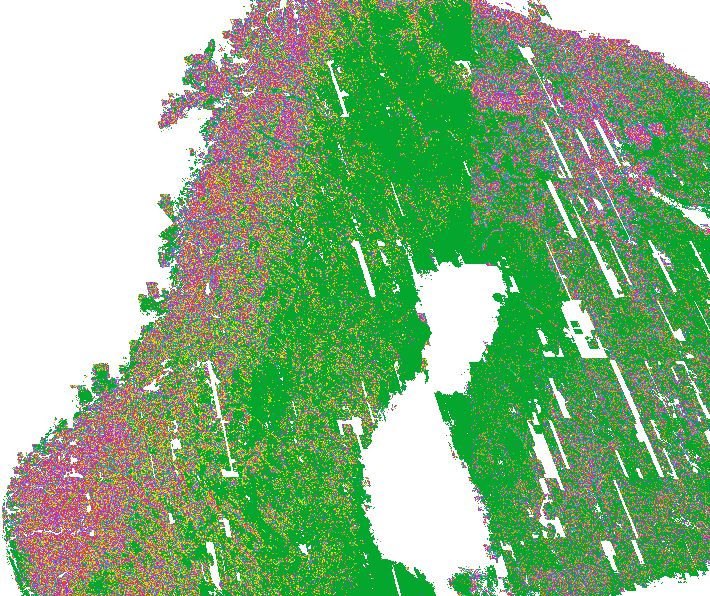
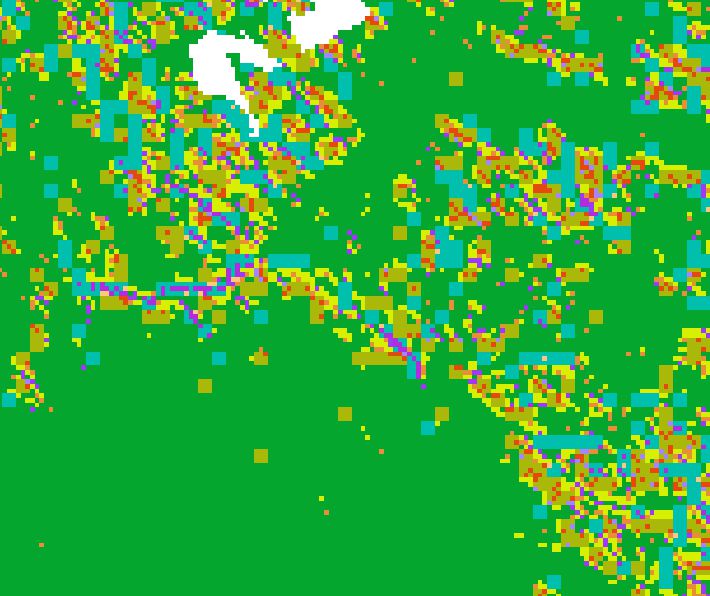
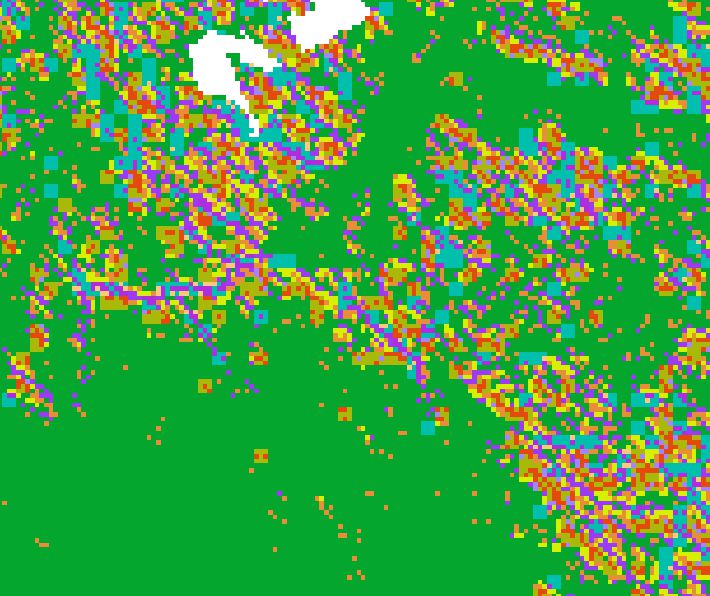
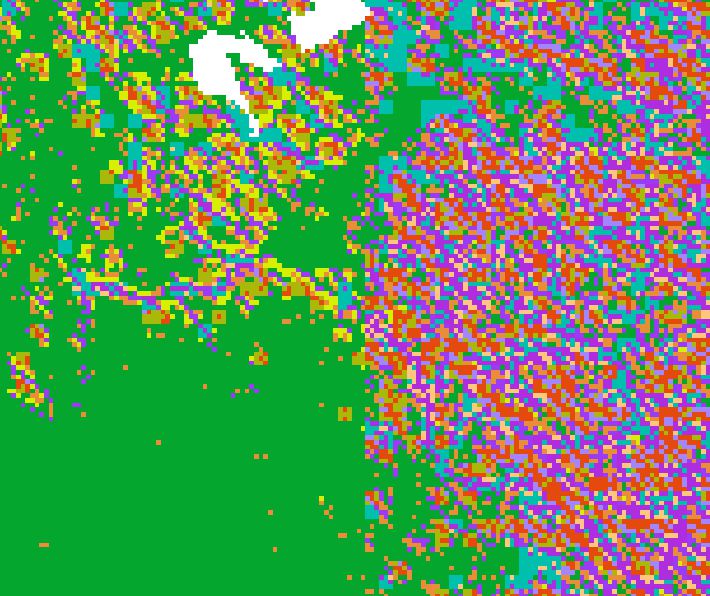
Figure 1 illustrates the four classification options for parts of the Nordic Countries. Note how the locally standardized classification creates different scalings in the western (Norway and Sweden) compared to the Eastern (Finland) region. This is because the mountain range between Norway and Sweden causes the TPI standard deviation in that tile (h18v02) to be much larger compared to the tile covering Finland (h19v02) that is more or less devoid of mountains. Figure 2 shows a detailed section across the two tiles.