
This post is mainly for myself, in case I ever need to retrieve the original data from my Post-Doc period again.
Landsat scenes
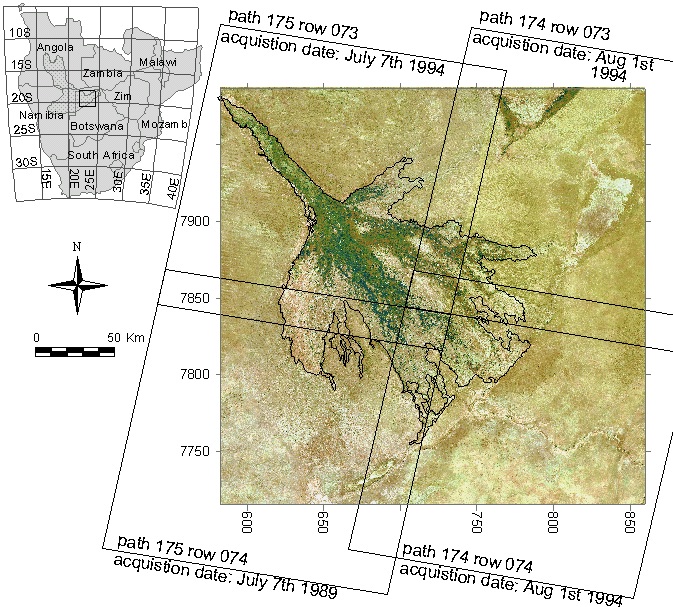
This is restricted to the four landsat scenes that we got from Anglo American, Figure 1.
| Scene | Acquisition date |
|---|---|
| p174r073 | 19940801 |
| p174r074 | 19940801 |
| p175r073 | 19940701 |
| p175r074 | 19890707 |
Geometric precision
When we started the projects on the Okavango in 1999, the signals from the Global Positioning System (GPS) were purposefully degraded and had an accuracy of around 100 m. The Landsat data that we used thus had rather large geometric errors. theoretical geometric error compared to orthorectified aerial photo maps were estimated to about 50 m. The orthorectified photos, however, were also not correct inside the vast Okavango wetlands. As several studies used the four Landsat scenes shown in the figure above, all maps resulting from these studies are plagued by (the same) geometric errors.
Original data
The original landsat scenes are not yet retrieved
Natural color composite
The natural color (pleasing) composite created using the ERmapper “pleasing.alg” algorithm, exists in many duplicated. But almost all are in reduced (36 m) spatial resolution. However, the original, at 28.5 m did exists as an .ers. The script below fixes the .ers pleasing image data. Note that I manually edited the nodata to get rid of some stupid wholes in the original version. This means that the 2019 updated version is better compared to the original. Shell script for fixing it with GDAL and ImageMagick:
#Original pleasing image at 28 m
/Library/Frameworks/GDAL.framework/Versions/2.4/Programs/gdalwarp -overwrite -tr 28.5 28.5 -s_srs "+proj=utm +zone=34 +south +ellps=clrk80 +units=m +no_defs" -t_srs EPSG:32734 /Volumes/tgdata/mjtrans/ICRAF_timemachine/Users/thomasgumbricht/tempwork/okacd/one/pleasing_delta_LARGE.ers temp.tif

#Translate to fit the landcover map (the new standard extension)
/Library/Frameworks/GDAL.framework/Versions/2.4/Programs/gdal_translate -a_ullr 580276.5443080846453086 7988350.1142306961119175 869808.0443080846453086 7718768.6142306961119175 temp.tif natcol_lt05_okaswamps_199407_rgb-bands.tif

#Use ImageMagick to quantisize to 256 colors
convert natcol_lt05_okaswamps_199407_rgb-bands.tif +dither  -colors 255  natcol_lt05_okaswamps_199407_byte.png

#Convert to tiff
/Library/Frameworks/GDAL.framework/Versions/2.4/Programs/gdal_translate -a_srs EPSG:32734 -a_ullr 580276.5443080846453086 7988350.1142306961119175 869808.0443080846453086 7718768.6142306961119175 natcol_lt05_okaswamps_199407_byte.png natcol_lt05_okaswamps_199407_byte.tif
The layer available for download on karttur´s GithHub pages is the quantisized (byte range, single band) version (natcol_lt05_okaswamps_199407_byte.tif).
AVHRR dataset
We had two different sources of AVHRR images. Via the USAid Famine Early Warning System (FEWS) 10-day composites of AVHRR data over the whole of Africa were freely available for 1992, 1993 and 1995. And then the South African Institute for Soil, Climate and Water had stored AVHRR images over southern Africa starting in 1985.
AVHRR 1985-2000
In total we got access to 2951 AVHRR scenes from the Institute for Soil, Climate and Water for the period 1985 to 2000. In a first step we reprojected these to SUTM 34 and masked out all clouds. From the 2951 scenes we selected the best 381 and applied a clustering classification with manual selection of flooded areas (see figure 7 for a summary of the method). A three-dimensional contextual and weighted filter – using the preceding and following images as the third dimension, smoothed the initial water classification. Pixel locations with clouds were handled by seeking the closest cloud-free image for that pixel. In total we created complete flooding maps for 373 dates.
Orignal dataset
The original dataset, as we got it from the South African Institute for Soil, Climate and Water are available under “./old_CDs/okavango/AVHRR_flood/original”. All 2951 scenes were cloudmasked and saved in Ermapper formats. These can be imported using the python function ImportErsHeadersAVHRRraw. These files are not available on Karttur´s GitHub pages. The shell script that converts all the images to GeoTiff is called avhrr_import_raw.sh, it is available on GitHub
Selected 10-day composites
The 373 dates with complete flood mask coverage are available under ‘./old_CDs/okavango/AVHRR_flood/flood/’, and can be imported by running the python function CreateErsHeadersAVHRRf3DailyComp. These images are available on GitHub. The shell script that converts all the images to GeoTiff is called avhrr_import_raw.sh, it is available on GitHub. Note that the script requires a template file for the ers to be created for each image.
Monthly floodmasks
The 373 dates were combined and resampled to represent monthly flood masks. This was done in two version, one including all flooding within the larger Okavango region (also including Lake Nagami and Linyanti swamps), and one version only identifying flooding inside a mask of the Okavango.
The monthly images including Lake Ngami and Linyanti are available under “./old_CDs/okavango/VAIO/Data_spatial/flood/Monthly_byteimages_Linynti_Ngami”. And the images masked to only include the Okavango swamps are under “./old_CDs/okavango/VAIO/Data_spatial/flood/Monthly_Byteimages”. To create the shell script for importing al of them run the python function CreateErsHeadersMonthly. Both sets of images are available on Karttur’s Github repository. The script files are called avhrr_monthly-flooding-oka-only.sh and CreateErsHeadersMonthlyOkaLinyantiNgami.sh and also available on Karttur’s Github repository.
Monthly flood frequencies
For the period 1985 to 2000, the flooding frequencies for each month (January to December) were calculated. The image data is available under ‘./old_CDs/okavango/VAIO/Data_spatial/flood/ERMapper/’. The python function ImportErsHeadersAVHRRmonthlyfreq creates the shell script file (avhrr_flooding-freq-month-import.sh) for importing these images. The images are available on Karttur’s GitHub repository.
The conversion of the data layers to graphical figures with colors and text are done by two stand-alone python functions IMFloodGraphicsAVHRR_okaonly.sh and IMFloodGraphicsAVHRR_oka_linyanti_ngami.sh. These images are shown in post on AVHRR, ATSR and Landsat quicklook images.
1985-2000 overall flooding frequency
The overall flooding frequency 19985 to 2000 is imported using GDAL, and then ImageMagick is used for creating a quicklook for the blog.
#Import overall flooding frequency as GeoTif
/Library/Frameworks/GDAL.framework/Versions/2.4/Programs/gdal_translate -a_srs EPSG:32734 /Volumes/tgdata/old_CDs/okavango/VAIO/Data_spatial/flood/RawData/Frequency/oka_delta_flooding_frequency_%_1985_to_2000.img.ers floodfreq_avhrr_okaswamps_1985-2000_0.tif
#Create a jpg quicklook for the blog
convert oka-pleasing_bg_AVHRR_1km.png \( -fuzz 5% -transparent white /Volumes/tgdata/old_CDs/okavango/VAIO/Data_spatial/flood/Monthly_average_graphics/oka_delta_flooding_frequency_%_1985_to_2000.bmp -alpha set -channel A -evaluate set 50% \) -gravity center -flatten temp.png
convert -crop 281x271+24+11 temp.png floodfreq_avhrr_okaswamps_1985-2000_0.png
ImageMagick script for creating the image of overall flooding frequency in the blog.
convert -crop 281x271+24+11 temp.png -pointsize 12 -font Trebuchet -fill 'RGBA(0,10,200,1)' -gravity north -annotate -30+20 'Okavango Delta, Botswana' -gravity south -annotate +30+60 'Flooding frequency from AVHRR images' -annotate +30+45 '1985-2000' \( -size 303x300 xc:none -font Trebuchet -pointsize 45 -gravity center -draw "fill rgba(120,120,120,0.20) text 2,2 'KARTTUR' fill rgba(225,225,225,0.20) text -2,-2 'KARTTUR' fill grey text 0,0 'KARTTUR' " -transparent grey -fuzz 90% \) -composite -quality 80 floodfreq_avhrr_okaswamps_1985-2000_0.jpg
FEWS AVHRR 1992, 1993 and 1995
The FEWS AVHRR data were only used for the initial studies, developing the concepts. Only the annual frequencies could be found, and are imported using a shell script, including the creation of blog ready quicklooks using ImageMagick.
/Library/Frameworks/GDAL.framework/Versions/2.4/Programs/gdalwarp -overwrite  -s_srs "+proj=utm +zone=34 +south +ellps=clrk80 +units=m +no_defs" -t_srs EPSG:32734 /Volumes/tgdata/old_CDs/okavango/delta/HYDRO/h2o_1992_noaa temp.tif
/Library/Frameworks/GDAL.framework/Versions/2.4/Programs/gdal_translate -srcwin 0 0 606 600 -a_ullr 556750.0 8000000.0 859750.0 7700000.0 temp.tif floodfreq_avhrr_okaswamps_1992_fews.tif

/Library/Frameworks/GDAL.framework/Versions/2.4/Programs/gdal_translate floodfreq_avhrr_okaswamps_1992_fews.vrt temp.tif
convert oka-pleasing_bg_landsat_500m.png \( temp.tif -alpha set -channel A -evaluate set 60% \) -gravity center -flatten temp.png
convert -crop 562x542+48+22 temp.png floodfreq_avhrr_okaswamps_1992_fews.png
convert floodfreq_avhrr_okaswamps_1992_fews.png -pointsize 24 -font Trebuchet -fill 'RGBA(0,10,200,1)' -gravity north -annotate -50+25 'Okavango Delta, Botswana' -gravity southwest -annotate +70+125 'Annual flooding frequency from AVHRR images' -annotate +285+90 '1992' \( -size 606x600 xc:none -font Trebuchet -pointsize 100 -gravity center -draw "fill rgba(120,120,120,0.20) text 2,2 'KARTTUR' fill rgba(225,225,225,0.20) text -2,-2 'KARTTUR' fill grey text 0,0 'KARTTUR' " -transparent grey -fuzz 90% \) -composite -quality 72 floodfreq_avhrr_okaswamps_1992_fews.jpg
convert floodfreq_avhrr_okaswamps_1992_fews.jpg -resize 240x floodfreq_avhrr_okaswamps_1992_fews-ql.jpg

/Library/Frameworks/GDAL.framework/Versions/2.4/Programs/gdalwarp -overwrite  -s_srs "+proj=utm +zone=34 +south +ellps=clrk80 +units=m +no_defs" -t_srs EPSG:32734 /Volumes/tgdata/old_CDs/okavango/delta/HYDRO/h2o_1993_noaa temp.tif
/Library/Frameworks/GDAL.framework/Versions/2.4/Programs/gdal_translate -srcwin 0 0 606 600 -a_ullr 556750.0 8000000.0 859750.0 7700000.0 temp.tif floodfreq_avhrr_okaswamps_1993_fews.tif

/Library/Frameworks/GDAL.framework/Versions/2.4/Programs/gdal_translate floodfreq_avhrr_okaswamps_1993_fews.vrt temp.tif
convert oka-pleasing_bg_landsat_500m.png \( temp.tif -alpha set -channel A -evaluate set 60% \) -gravity center -flatten temp.png
convert -crop 562x542+48+22 temp.png floodfreq_avhrr_okaswamps_1993_fews.png
convert floodfreq_avhrr_okaswamps_1993_fews.png -pointsize 24 -font Trebuchet -fill 'RGBA(0,10,200,1)' -gravity north -annotate -50+25 'Okavango Delta, Botswana' -gravity southwest -annotate +70+125 'Annual flooding frequency from AVHRR images' -annotate +285+90 '1993' \( -size 606x600 xc:none -font Trebuchet -pointsize 100 -gravity center -draw "fill rgba(120,120,120,0.20) text 2,2 'KARTTUR' fill rgba(225,225,225,0.20) text -2,-2 'KARTTUR' fill grey text 0,0 'KARTTUR' " -transparent grey -fuzz 90% \) -composite -quality 72 floodfreq_avhrr_okaswamps_1993_fews.jpg
convert floodfreq_avhrr_okaswamps_1993_fews.jpg -resize 240x floodfreq_avhrr_okaswamps_1993_fews-ql.jpg

/Library/Frameworks/GDAL.framework/Versions/2.4/Programs/gdalwarp -overwrite  -s_srs "+proj=utm +zone=34 +south +ellps=clrk80 +units=m +no_defs" -t_srs EPSG:32734 /Volumes/tgdata/old_CDs/okavango/delta/HYDRO/h2o_1995_noaa temp.tif
/Library/Frameworks/GDAL.framework/Versions/2.4/Programs/gdal_translate -srcwin 0 0 606 600 -a_ullr 556750.0 8000000.0 859750.0 7700000.0 temp.tif floodfreq_avhrr_okaswamps_1995_fews.tif

/Library/Frameworks/GDAL.framework/Versions/2.4/Programs/gdal_translate floodfreq_avhrr_okaswamps_1995_fews.vrt temp.tif
convert oka-pleasing_bg_landsat_500m.png \( temp.tif -alpha set -channel A -evaluate set 60% \) -gravity center -flatten temp.png
convert -crop 562x542+48+22 temp.png floodfreq_avhrr_okaswamps_1995_fews.png
convert floodfreq_avhrr_okaswamps_1995_fews.png -pointsize 24 -font Trebuchet -fill 'RGBA(0,10,200,1)' -gravity north -annotate -50+25 'Okavango Delta, Botswana' -gravity southwest -annotate +70+125 'Annual flooding frequency from AVHRR images' -annotate +285+90 '1995' \( -size 606x600 xc:none -font Trebuchet -pointsize 100 -gravity center -draw "fill rgba(120,120,120,0.20) text 2,2 'KARTTUR' fill rgba(225,225,225,0.20) text -2,-2 'KARTTUR' fill grey text 0,0 'KARTTUR' " -transparent grey -fuzz 90% \) -composite -quality 72 floodfreq_avhrr_okaswamps_1995_fews.jpg
convert floodfreq_avhrr_okaswamps_1995_fews.jpg -resize 240x floodfreq_avhrr_okaswamps_1995_fews-ql.jpg
Landsat quicklooks
FROM the USGS online archive of available Landsat scenes back in 2000, we grabbed all the quicklooks we could find (totaling 92). Using an automatic clustering routine followed by manual selection of water classes we created water masks for each individual scene. The scene data is stored under “./old_CDs/okavango/VAIO/Data_spatial/flood/ArcView_Landsat_1972-2004/scenes”. To create a shell script file for importing the data, run the python module ImportLandsatArcViewDaily. The shell script that is created is called landsat-scenes_flooding-fix.sh. The flood masks for all scene are are available on Karttur’s GitHub repository.
Monthly composites
For months with complete (or almost complete) coverage over the Okavango, we created monthly inundation masks. The monthly composites are available under “./old_CDs/okavango/VAIO/Data_spatial/flood/ArcView_Landsat_1972-2004/Mosaics”. To create a shell script file for importing the data, run the python module ImportLandsatArcViewMonthly. The shell script that is created is called landsat-monthly_flooding-fix.sh. The flood masks for all available months are on Karttur’s GitHub repository. The script includes the ImageMagick commands for creating quicklook figures and they are all (12 in total) shown in the blog post on AVHRR, ATSR and Landsat quicklook images.
Annual max floods
From the scene data, the annual maximum extent (accumulated) of the inundation area were extracted. These annual composites are available under “./old_CDs/okavango/VAIO/Data_spatial/flood/ArcView_Landsat_1972-2004/Annual_max_flood”. To create a shell script file for importing the data, run the python module ImportLandsatArcViewAnnual. The shell script that is created is called landsat-annual_flooding-fix.sh. The flood masks for all annual composites are are available on Karttur’s GitHub repository. The script includes the ImageMagick commands for creating quicklook figures and they are all (8 in total) shown in the blog post on AVHRR, ATSR and Landsat quicklook images.
ATSR
For 1999 and 2000 we acquired 28 ATSR scenes over the Okavango. The raw scenes are available under “./old_CDs/okavango/VAIO/Data_spatial/flood/Work/atsr/ermapper”. To import them run the python function ImportErsRawATSR. The script requires a template file for creating Ermapper .ers headers (template.ers). The script then produces a shell script file, atsr-rawbands.sh.
The ATSR scenes (with 7 bands), cut to fit the larger Okavango area are available in Karttur’s GitHub repository.
Unsupervised classification
For each ATSR scene the unsupervised clustering is also available, under “./old_CDs/okavango/VAIO/Data_spatial/flood/Work/atsr/idriATSR”. Create the shell script (atsr_clustering-fix.sh</file>)for importing the clustered ATSR data by running the python function CreateErsHeadersATSR. All the clusters are availabale are available in Karttur’s GitHub repository.
ATSR floodmasks
The images with the classification of the clusters into floodmasks is available under “./old_CDs/okavango/Delta_2/flood”. The import function is the same as for the clusters, and the python function (CreateErsHeadersATSR) must be manually edited to work for each import. All the masks are availabale are available in Karttur’s GitHub repository.
Flood accuracy evaluations
In total, the accuracy of the flood masks were tested comparing 12 dates. For each of these 12 dates we created flood masks from data representing two different sensors, either AVHRR versus ATSR, or AVHRR versus Landsat. The cross tabulation images are available under “./old_CDs/okavango/VAIO/Data_spatial/flood/Work”. Create the shell script (crosstab_flooding-fix.sh</file>) for importing the cross correlation data by running the python function CreateErsHeadersCrossTab.
The generated script includes the ImageMagick commands for creating the quicklooks that are shown in the blog post on AVHRR, ATSR and Landsat quicklook images.
Flood frequency at high spatial resolution
Combining the flood frequency data with the Landsat composition, a flood mask in 28.5 spatial resolution could be created. The script for importing it and fit it exactly to the pleasing landsat composite and the landcover classification:
#Import flooding at 28.5 m
/Library/Frameworks/GDAL.framework/Versions/2.4/Programs/gdalwarp -overwrite -s_srs "+proj=utm +zone=34 +south +ellps=clrk80 +units=m +no_defs" -t_srs EPSG:32734 /Volumes/Pegasus6/oldstuff/Pegasus6/old_CDs/okavango/delta/HYDRO/FLLOOD28 FLLOOD28.tif
#Translate to fit the landcover
/Library/Frameworks/GDAL.framework/Versions/2.4/Programs/gdal_translate -a_ullr 580276.5443080846453086 7988350.1142306961119175 869808.0443080846453086 7718768.6142306961119175 FLLOOD28.tif floodfreq_combo_okaswamps_1992-2000_28m.tif

#Create a virtual copy
/Library/Frameworks/GDAL.framework/Versions/2.4/Programs/gdalbuildvrt highresol_floodmap.vrt floodfreq_combo_okaswamps_1992-2000_28m.tif

#Manually add colors, then recreate a color ramped flooding image
/Library/Frameworks/GDAL.framework/Versions/2.4/Programs/gdal_translate highresol_floodmap.vrt floodfreq_multisource_okaswamps_1992-2000_28m.tif

#Craete a small image
convert -resize 800x +repage floodfreq_multisource_okaswamps_1992-2000_28m.tif floodfreq_multisource_okaswamps_1992-2000_m.png

#Overlay flood and pleasing landsat
convert natcol_lt05_okaswamps_199407_m.png \( floodfreq_multisource_okaswamps_1992-2000_m.png -alpha set -channel A -evaluate set 60% \) -gravity center -flatten temp.png

#Add text to the overlay
convert temp.png -pointsize 30 -font Trebuchet -fill 'RGBA(0,10,200,1)' -gravity north -annotate -100+10 'Okavango Delta, Botswana' -gravity southwest -annotate +365+65 'Multi source flooding frequency' -annotate +515+30 '1972-2000' \( -size 606x600 xc:none -font Trebuchet -pointsize 140 -gravity center -draw "fill rgba(120,120,120,0.20) text 2,2 'KARTTUR' fill rgba(225,225,225,0.20) text -2,-2 'KARTTUR' fill grey text 0,0 'KARTTUR' " -transparent grey -fuzz 90% \) -composite -quality 80 floodfreq_multisource_okaswamps_1992-2000_m.jpg
Geophysiology
Shell script for importing and arranging the geophysiology spatial layers:
# geophsysiological regions
/Library/Frameworks/GDAL.framework/Versions/2.4/Programs/ogr2ogr -s_srs "+proj=utm +zone=34 +south +ellps=clrk80 +units=m +no_defs" -t_srs EPSG:4326 geophysiology_wits_okaswamps_1994_pub.shp "/Volumes/tgdata/old_CDs/okavango/Delta_2/flood/physiographic_regions.shp"

# arc maximum delta
/Library/Frameworks/GDAL.framework/Versions/2.4/Programs/ogr2ogr -s_srs "+proj=utm +zone=34 +south +ellps=clrk80 +units=m +no_defs" -t_srs EPSG:4326 maxflood-arc_wits_okaswamps_1994_pub.shp "/Volumes/tgdata/old_CDs/okavango/VAIO/Data_spatial/Hydrology/ArcView/oka_delta_arc.shp"

#Shape files of flooding frequency
#50%
/Library/Frameworks/GDAL.framework/Versions/2.4/Programs/ogr2ogr -s_srs "+proj=utm +zone=34 +south +ellps=clrk80 +units=m +no_defs" -t_srs EPSG:4326 flooding-freq-50%_satimg_okaswamps_1972-2000_0.shp "/Volumes/tgdata/old_CDs/okavango/islands/delta/HYDRO/h2o_50%_of_time.shp"
#65%
/Library/Frameworks/GDAL.framework/Versions/2.4/Programs/ogr2ogr -s_srs "+proj=utm +zone=34 +south +ellps=clrk80 +units=m +no_defs" -t_srs EPSG:4326 flooding-freq-65%_satimg_okaswamps_1972-2000_0.shp "/Volumes/tgdata/old_CDs/okavango/islands/delta/HYDRO/h2o_65%_of_time.shp"
Ecoregion classification
The ecoregion map was done by combining multi-source datasets using expert rules (if … then … else …). Almost 20 year later I have not been able to dis-entangle the input data and the rules, but the final ecoregion map can be imported and symbolized through these GDAL commands:
#Import the original landcover classification as a virtual layer
/Library/Frameworks/GDAL.framework/Versions/2.4/Programs/gdalbuildvrt oka_lc.vrt /Volumes/tgdata/old_CDs/okavango/okaCD1.1/OKAVANGO/Delta/landcover/rawdata/oka_delta_landcover_classification.img.ers

#To put colors and labels the vrt dataset must be manually edited

#Warp the virutal layer to EPSG:32734
/Library/Frameworks/GDAL.framework/Versions/2.4/Programs/gdalwarp -tr 28.50 28.50 -overwrite oka-lc_karttur_okaswamps_1994_pub.vrt landcover_lt05_okaswamps_1994_pub.tif -t_srs EPSG:32734
The edited virtual layer with labels and colors added:
<VRTDataset rasterXSize="10159" rasterYSize="9458">
  <SRS>PROJCS["SUTM34",GEOGCS["CAPE DATUM",DATUM["CAPE",SPHEROID["CLA80MOD",6378249.145,293.465]],PRIMEM["Greenwich",0],UNIT["degree",0.0174532925199433]],PROJECTION["Transverse_Mercator"],PARAMETER["latitude_of_origin",0],PARAMETER["central_meridian",21],PARAMETER["scale_factor",0.9996],PARAMETER["false_easting",500000],PARAMETER["false_northing",10000000],UNIT["Meter",1]]</SRS>
  <GeoTransform>  5.8027850000000000e+05,  2.8500000000000000e+01,  0.0000000000000000e+00,  7.9885245000000000e+06,  0.0000000000000000e+00, -2.8500000000000000e+01</GeoTransform>
  <VRTRasterBand dataType="Byte" band="1">
    <SimpleSource>
      <SourceFilename relativeToVRT="1">oka_delta_landcover_classification.img.ers</SourceFilename>
      <SourceBand>1</SourceBand>
      <SourceProperties RasterXSize="10159" RasterYSize="9458" DataType="Byte" BlockXSize="10159" BlockYSize="1" />
      <SrcRect xOff="0" yOff="0" xSize="10159" ySize="9458" />
      <DstRect xOff="0" yOff="0" xSize="10159" ySize="9458" />
    </SimpleSource>
    <CategoryNames>
  		<Category>Water</Category>
  		<Category>Permanent wetland (dominated by papyrus and reed)</Category>
  		<Category>primary floodplain (inundated 30 - 80 % of time)</Category>
  		<Category>Secondary floodplain (inundated 10 - 50 % of time)</Category>
  		<Category>Wet meadow (Grassland with occasional flooding)</Category>
  		<Category>Riverine forest</Category>
  		<Category>Pan/Dry grasspand (with occasional flooding)</Category>
  		<Category>Dry woodland (dominated by Acacia)</Category>
  		<Category>Dry woodland (dominated by Mopane)</Category>
  		<Category>Dry woodland (dominated by Combretum)</Category>
  		<Category>Grassland</Category>
  		<Category>Pan/grassland (non-flooded)</Category>
	</CategoryNames>
	<ColorTable>
  		<Entry c1="0" c2="0" c3="0" c4="255"/>
  		<Entry c1="92" c2="0" c3="231" c4="255"/>
  		<Entry c1="0" c2="131" c3="128" c4="255"/>¨
  		<Entry c1="0" c2="186" c3="152" c4="255"/>¨
  		<Entry c1="162" c2="143" c3="0" c4="255"/>¨
  		<Entry c1="221" c2="228" c3="0" c4="255"/>¨
  		<Entry c1="0" c2="109" c3="0" c4="255"/>¨
  		<Entry c1="228" c2="227" c3="138" c4="255"/>¨
  		<Entry c1="133" c2="180" c3="0" c4="255"/>¨
  		<Entry c1="118" c2="161" c3="0" c4="255"/>¨
  		<Entry c1="135" c2="181" c3="0" c4="255"/>¨
  		<Entry c1="255" c2="219" c3="89" c4="255"/>¨
  		<Entry c1="254" c2="254" c3="189" c4="189"/>¨
	</ColorTable>
  </VRTRasterBand>
</VRTDataset>
The layers imported with the scripts above are availlable on Karttur´s GitHub repository.
Regional topography
The research that led to the regional topographic maps over the Okavango and surrounding regions was based on a limited sets of elevation data, plus the Landsat color composite (see above). The study led to a large set of datasets, all listed and available for download in the blog post on Regional topography post. The scripts for converting the old data to updated formats are summarized here. Most of the data are re-organized using the python module geoimagine.okavango.dem.
Elevation datasets
Four different sources of point elevation data were used for interpolating a DEM in 500 m spatial resolution, table 2.
| Dataset | description |
|---|---|
| gps-grav-survey | Gravity survey with differential GPS positioning Geological Survey of Botswana |
| beacons | Trigonemetric beacons identified from official Botswana maps |
| UCT-GPS | Differential GPS positioning along major channels of the Okavango swamps University of Cape Town |
| DCW | Beacon heights in the Namibian part of Linyanti Digital Chart of the World (DCW) |
The gps-grav-survey is available under “./Okavango/oka-dem-fixed/dem_gen_areas_pts/dem_all_grav/dem_all_grav.shp”, to import it call the python function CheckFixDBFptElev (direct or via CheckFixDBFptElevIni). The expected attributes to find in the layer dem_all_grav.shp are hardcoded in CheckFixDBFptElev so you can not alter any input names. The beacons dataset is available under “./Okavango/oka-dem-fixed/dem_ptdata/beacon_tm_ortho/beacon_tm_ortho.shp”. The other datasets (UCT-GPS and DCW) only covers a single subregion each and are available as sub-regional datasets.
Regionalization
The larger Okavango region is clearly defined by fault lines, but with incised river beds. Table 3 lists the support layers used for creating the Okavango DEM.
| Layer name | Layer content |
|---|---|
| fault-lines_karttur_okaswamps_0_v2001 | Fault lines |
| rivers-channels_karttur_okaswamps_0_digitized | River channels |
| geophysiology_wits_okaswamps_1994_pub | Geophysiological regions of the Okavango swmaps |
| elev-regions_karttur_okaswamps_0_4demcreate | Elevation regions |
The original regionalization data were manually fixed in July 2019; the fault lines where updated and labels added, the river dataset was not updates but the regional layer was cleaned and the sub-regions joined to multi-polygons.
Regionalized input elevation datasets
The regional Okavango DEM was generated dividing the area in 4 sub-regions. The elevation point data used as input for the kriging interpolation of the DEM are supplied per region and source dataset and available in the Regional DEM post, or from Karttur’s GitHub repository.
To import the (partly organized) original data, run the python function CheckFixDBFptElevIni and use the file listing all the regionalized data source and destination files (dem_gen_pt_shape_files.txt) as input:
/Volumes/karttur/oka-dem-fixed/dem_gen_areas_pts/dem_gen_nv_grav/dem_gen_nv_grav.shp,/Volumes/karttur/okavango/dem/oka/elev-pt-subreg_gps-grav-survey_okaswamps_2000_nw-drylands.shp

/Volumes/karttur/oka-dem-fixed/dem_gen_areas_pts/dem_gen_delta_grav/dem_gen_delta_grav.shp,/Volumes/karttur/okavango/dem/oka/elev-pt-subreg_gps-grav-survey_okaswamps_2000_oka-wetlands.shp

/Volumes/karttur/oka-dem-fixed/dem_gen_areas_pts/dem_gen_kun_grav/dem_gen_kun_grav.shp,/Volumes/karttur/okavango/dem/oka/elev-pt-subreg_gps-grav-survey_okaswamps_2000_kunyere-trappa.shp

/Volumes/karttur/oka-dem-fixed/dem_gen_areas_pts/dem_gen_se_grav/dem_gen_se_grav.shp,/Volumes/karttur/okavango/dem/oka/elev-pt-subreg_gps-grav-survey_okaswamps_2000_se-drylands.shp

/Volumes/karttur/oka-dem-fixed/dem_gen_areas_pts/dem_gen_delta_bb/dem_gen_delta_bb.shp,/Volumes/karttur/okavango/dem/oka/elev-pt-subreg_beacons_okaswamps_2000_oka-wetlands.shp

/Volumes/karttur/oka-dem-fixed/dem_gen_areas_pts/dem_gen_kun_bb/dem_gen_kun_bb.shp,/Volumes/karttur/okavango/dem/oka/elev-pt-subreg_beacons_okaswamps_2000_kunyere-trappa.shp

/Volumes/karttur/oka-dem-fixed/dem_gen_areas_pts/dem_gen_nv_bb/dem_gen_nv_bb.shp,/Volumes/karttur/okavango/dem/oka/elev-pt-subreg_beacons_okaswamps_2000_nw-drylands.shp

/Volumes/karttur/oka-dem-fixed/dem_gen_areas_pts/dem_gen_se_bb/dem_gen_se_bb.shp,/Volumes/karttur/okavango/dem/oka/elev-pt-subreg_beacons_okaswamps_2000_se-drylands.shp

/Volumes/karttur/oka-dem-fixed/dem_gen_areas_pts/dem_gen_delta_uct/dem_gen_delta_uct.shp,/Volumes/karttur/okavango/dem/oka/elev-pt-subreg_gps-uct_okaswamps_2000_oka-wetlands.shp

/Volumes/karttur/oka-dem-fixed/dem_gen_areas_pts/dem_gen_linyanti/dem_gen_linyanti.shp,/Volumes/karttur/okavango/dem/oka/elev-pt-subreg_dcw_okaswamps_2000_nw-drylands.shp

/Volumes/karttur/oka-dem-fixed/dem_gen_areas_pts/dem_gen_remain_bb/dem_gen_remain_bb.shp,/Volumes/karttur/okavango/dem/oka/elev-pt-unused_beacons_okaswamps_2000_all-regions.shp

/Volumes/karttur/oka-dem-fixed/dem_gen_areas_pts/dem_all_grav/dem_all_grav.shp,/Volumes/karttur/okavango/dem/oka/elev-pt_gps-grav-survey_botswana_2000_bw-geosurvey.shp

/Volumes/karttur/oka-dem-fixed/dem_gen_areas_pts/dem_pt_all/dem_pt_all.shp,/Volumes/karttur/okavango/dem/oka/elev-pt_all_botswana_2000_no-pub.shp
The input names are hardcoded in the function (CheckFixDBFptElevIni) and you can not change the input names, then the attribute fixing will not work. If done correctly, you will get all the regionalized point data in one go.
Okavango DEM
The Digital Elevation Model (DEM) for the larger Okavango region was constructed by joining the kriging interpolated DEMs of the respective subregion. I can not find the individual sub-regional DEMs, but the combined DEM, along with estimated kriging accuracies is available. To organzie properly, run the following script:
/Library/Frameworks/GDAL.framework/Versions/2.4/Programs/gdalwarp -tr 500 500 -overwrite -s_srs "+proj=utm +zone=34 +south +ellps=clrk80 +units=m +no_defs" -t_srs EPSG:32734 /Volumes/karttur/oka-dem-ArcView/dem_0720_00 dem_karttur_okaswamps_0_v2001.tif
/Library/Frameworks/GDAL.framework/Versions/2.4/Programs/gdalwarp -tr 500 500  -overwrite -s_srs "+proj=utm +zone=34 +south +ellps=clrk80 +units=m +no_defs" -t_srs EPSG:32734 /Volumes/karttur/oka-dem-more/arcview/oka_dem_err dem-sd_wits_okaswamps_0_v2001.tif
From this raster DEM the contour lines were extracted, but must have been manually edited to fit heights and troughs. NOTE, that I also edited the contour lines in 2019 so re-running the import function will not lead to an exact copy of the existing layer:
/Library/Frameworks/GDAL.framework/Versions/2.4/Programs/ogr2ogr -s_srs "+proj=utm +zone=34 +south +ellps=clrk80 +units=m +no_defs" -t_srs EPSG:32734 elev-contours_karttur_okaswamps_0_v2001.shp "/Volumes/karttur/oka-dem-ArcView/oka_contours.shp"
The Okavango alluvial fan
The vector data related to the Okavango alluvial fan was also edited in July 2019, fine tuning the extent of the fan surface (fan origin and fan iso-distance lines were not changed). To import the original fan vector data run the shell script:
#fan_area.shp: NOTE that the area is updated compared to the source layer
/Library/Frameworks/GDAL.framework/Versions/2.4/Programs/ogr2ogr -s_srs "+proj=utm +zone=34 +south +ellps=clrk80 +units=m +no_defs" -t_srs EPSG:32734 alluvial-fan_karttur_okaswamps_0_v2001.shp "/Volumes/karttur/oka-dem-ArcView/fan_area.shp"

#fan_isolines_2.shp:
/Library/Frameworks/GDAL.framework/Versions/2.4/Programs/ogr2ogr -s_srs "+proj=utm +zone=34 +south +ellps=clrk80 +units=m +no_defs" -t_srs EPSG:32734 alluvial-fan-isodist_karttur_okaswamps_0_fromapex.shp "/Volumes/karttur/oka-dem-ArcView/fan isolines 2.shp"

#fan_origin.shp
/Library/Frameworks/GDAL.framework/Versions/2.4/Programs/ogr2ogr -s_srs "+proj=utm +zone=34 +south +ellps=clrk80 +units=m +no_defs" -t_srs EPSG:32734 alluvial-fan-apex_karttur_okaswamps_0_v2001.shp "/Volumes/karttur/oka-dem-ArcView/fan origin.shp"
When re-organzing the data in 2019 I could not find theoretical DEM for the perfectly conical surface of the alluvial fan. Instead I created a new conical DEM and a new residual for the difference between theoretical cone and observed DEM over the alluvial fan:
/#Theoretical cone DEM
/Library/Frameworks/GDAL.framework/Versions/2.4/Programs/gdal_calc.py -A alluvial-fan-distance_wits_okaswamps_0_fromapex.tif --outfile=alluvial-fan-cone-dem_karttur_okasvamps_0_v2001.tif  --calc="981.05-(42/160000)*A" --NoDataValue=0

#Difference between observed DEM and theoertical cone
/Library/Frameworks/GDAL.framework/Versions/2.4/Programs/gdal_calc.py -A dem_wits_okaswamps_0_0720.tif -B newcone.tif --outfile=alluvial-fan-residual-dem_karttur_okasvamps_0_v2001.tif  --calc="A-B" --NoDataValue=0
Lake Ngami Regional DEM
For the Lake Ngami region a special DEM was created back in 2000, and re-organized in 2019. Note that during the 2019 re-organization I edited some of the imported layers and re-running the GDAL functions in the script will not generate identical layers.
#Shoreline point data
/Library/Frameworks/GDAL.framework/Versions/2.4/Programs/ogr2ogr -s_srs "+proj=utm +zone=34 +south +ellps=clrk80 +units=m +no_defs" -t_srs EPSG:32734 elev-pt-palaeo-shore_karttur_lakengami_0_v2001.shp "/Volumes/karttur/oka-dem-ArcView/Ngami/ngami_shore_dem.shp"

#Palaeo shoreline
/Library/Frameworks/GDAL.framework/Versions/2.4/Programs/ogr2ogr -s_srs "+proj=utm +zone=34 +south +ellps=clrk80 +units=m +no_defs" -t_srs EPSG:32734 palaeo-shore-arc_karttur_lakengami_0_v2001.shp "/Volumes/karttur/oka-dem-ArcView/Ngami paleo shoreline.shp"

#central axis
/Library/Frameworks/GDAL.framework/Versions/2.4/Programs/ogr2ogr -s_srs "+proj=utm +zone=34 +south +ellps=clrk80 +units=m +no_defs" -t_srs EPSG:32734 centreline_karttur_lakengami_0_v2001.shp "/Volumes/karttur/oka-dem-ArcView/ngami/ngami_centroid.shp"

#Iso distance along centroid axis
/Library/Frameworks/GDAL.framework/Versions/2.4/Programs/ogr2ogr -s_srs "+proj=utm +zone=34 +south +ellps=clrk80 +units=m +no_defs" -t_srs EPSG:32734 isodist_karttur_lakengami_0_centreline.shp "/Volumes/karttur/oka-dem-ArcView/ngami/ngami_isodist.shp"

#ngami_contours.shp:
/Library/Frameworks/GDAL.framework/Versions/2.4/Programs/ogr2ogr -s_srs "+proj=utm +zone=34 +south +ellps=clrk80 +units=m +no_defs" -t_srs EPSG:32734 elev-contours_karttur_lakengami_0_v2001.shp "/Volumes/karttur/oka-dem-fixed/dem_ngami/oka_topo_ngami_contours/oka_topo_ngami_contours.shp"

#ngami_grav_dem.shp: The data used for generation Ngami DEM
/Library/Frameworks/GDAL.framework/Versions/2.4/Programs/ogr2ogr -s_srs "+proj=utm +zone=34 +south +ellps=clrk80 +units=m +no_defs" -t_srs EPSG:32734 elev-pt_gps_lakengami_1999_grav-survey.shp "/Volumes/karttur/oka-dem-ArcView/Ngami/ngami_grav_dem.shp"

#ngami_beacon_dem
/Library/Frameworks/GDAL.framework/Versions/2.4/Programs/ogr2ogr -s_srs "+proj=utm +zone=34 +south +ellps=clrk80 +units=m +no_defs" -t_srs EPSG:32734 elev-pt_beacon_lakengami_0_frommap.shp "/Volumes/karttur/oka-dem-ArcView/Ngami/ngami_beacon_dem.shp"

#DEM
/Library/Frameworks/GDAL.framework/Versions/2.4/Programs/gdalwarp -tr 500 500 -overwrite -s_srs "+proj=utm +zone=34 +south +ellps=clrk80 +units=m +no_defs" -t_srs EPSG:32734 /Volumes/karttur/oka-dem-ArcView/Ngami/ngami_dem dem_karttur_lakengami_0_v2001.tif

#Estimated error from kriging interpolation
/Library/Frameworks/GDAL.framework/Versions/2.4/Programs/gdalwarp -tr 500 500  -overwrite -s_srs "+proj=utm +zone=34 +south +ellps=clrk80 +units=m +no_defs" -t_srs EPSG:32734 /Volumes/karttur/oka-dem-ArcView/Ngami/ngami_sd dem-sd_karttur_lakengami_0_v2001.tif

#Natural color Landsat image
#Ngami pleasing image at 28 m  (from ecw - only source I can find)
/Library/Frameworks/GDAL.framework/Versions/2.4/Programs/gdalwarp -overwrite -s_srs "+proj=utm +zone=34 +south +ellps=clrk80 +units=m +no_defs" -t_srs EPSG:32734 /Volumes/tgdata/old_CDs/okavango/okaCD1.1/OKAVANGO/Delta/landcover/graphics/ngami_pleasing_tm.ecw natcol_lt05_lakengami_199407_rgb-bands.tif

#Use ImageMagick to quantisize to 256 colors
convert natcol_lt05_lakengami_199407_rgb-bands.tif +dither  -colors 255  natcol_lt05_lakengami_199407_byte.png

#Convert back to Geotiff tiff
#/Library/Frameworks/GDAL.framework/Versions/2.4/Programs/gdal_translate -a_srs EPSG:32734 -a_ullr 624161.4676754806423560 7760102.8934778925031424 715743.2956791395554319 7708511.9903688011690974  natcol_lt05_lakengami_199407_byte.png natcol_lt05_lakengami_199407_byte.tif
#60 m down
#100 m right
/Library/Frameworks/GDAL.framework/Versions/2.4/Programs/gdal_translate -a_srs EPSG:32734 -a_ullr 624261.4676754806423560 7760042.8934778925031424 715843.2956791395554319 7708451.9903688011690974  natcol_lt05_lakengami_199407_byte.png natcol_lt05_lakengami_199407_byte.tif
Mababe depression Regional DEM
For the Mababe depression region a special DEM was created back in 2000. Run the script below to re-organize the Mababe Depression regional DEM.
#Shoreline point data
/Library/Frameworks/GDAL.framework/Versions/2.4/Programs/ogr2ogr -s_srs "+proj=utm +zone=34 +south +ellps=clrk80 +units=m +no_defs" -t_srs EPSG:32734 elev-pt-palaeo-shore_karttur_mababedepr_0_v2001.shp "/Volumes/karttur/oka-dem-ArcView/mababe/mab_shore_dem.shp"

#Palaeo shoreline
/Library/Frameworks/GDAL.framework/Versions/2.4/Programs/ogr2ogr -s_srs "+proj=utm +zone=34 +south +ellps=clrk80 +units=m +no_defs" -t_srs EPSG:32734 palaeo-shore-arc_karttur_mababedepr_0_pos-from-lt05.shp "/Volumes/karttur/oka-dem-ArcView/mababe/mab_shores.shp"

#mababe_centroid.shp: central axis
/Library/Frameworks/GDAL.framework/Versions/2.4/Programs/ogr2ogr -s_srs "+proj=utm +zone=34 +south +ellps=clrk80 +units=m +no_defs" -t_srs EPSG:32734 centreline_karttur_mababedepr_0_v2001.shp "/Volumes/karttur/oka-dem-ArcView/mababe/mab_centroid.shp"

#mab_isodist.shp: MABABE ISO distance along centroid axis
/Library/Frameworks/GDAL.framework/Versions/2.4/Programs/ogr2ogr -s_srs "+proj=utm +zone=34 +south +ellps=clrk80 +units=m +no_defs" -t_srs EPSG:32734 isodist_karttur_mababedepr_0_centreline.shp "/Volumes/karttur/oka-dem-fixed/dem_mababe/mab_isodist/mab_isodist.shp"

#mababe_dem_contours.shp: This are the isohyeths from the DEM, without added other stuff
/Library/Frameworks/GDAL.framework/Versions/2.4/Programs/ogr2ogr -s_srs "+proj=utm +zone=34 +south +ellps=clrk80 +units=m +no_defs" -t_srs EPSG:32734 elev-contours_karttur_mababedepr_0_v2001.shp "/Volumes/karttur/oka-dem-fixed/dem_mababe/mababe_dem_contours/mababe_dem_contours.shp"

#mababe_grav_tm.shp: The data used for generation Ngami DEM
/Library/Frameworks/GDAL.framework/Versions/2.4/Programs/ogr2ogr -s_srs "+proj=utm +zone=34 +south +ellps=clrk80 +units=m +no_defs" -t_srs EPSG:32734 elev-pt_gps_mababedepr_1999_grav-survey.shp "/Volumes/karttur/oka-dem-ArcView/mababe/mababe_grav_tm.shp"

#DEM
/Library/Frameworks/GDAL.framework/Versions/2.4/Programs/gdalwarp -tr 500 500 -overwrite -s_srs "+proj=utm +zone=34 +south +ellps=clrk80 +units=m +no_defs" -t_srs EPSG:32734 /Volumes/karttur/oka-dem-ArcView/Mababe/mab_dem dem_karttur_mababedepr_0_v2001.tif

#Estimated error from kriging interpolation
/Library/Frameworks/GDAL.framework/Versions/2.4/Programs/gdalwarp -tr 500 500  -overwrite -s_srs "+proj=utm +zone=34 +south +ellps=clrk80 +units=m +no_defs" -t_srs EPSG:32734 /Volumes/karttur/oka-dem-ArcView/Mababe/mab_sd dem-sd_karttur_mababedepr_0_v2001.tif

#Mababe pleasing image at 28 m  (from ecw - only source I can find)
/Library/Frameworks/GDAL.framework/Versions/2.4/Programs/gdalwarp -overwrite -s_srs "+proj=utm +zone=34 +south +ellps=clrk80 +units=m +no_defs" -t_srs EPSG:32734 /Volumes/tgdata/old_CDs/okavango/okaCD1.1/OKAVANGO/Delta/landcover/graphics/mababe_pleasing_tm.ecw natcol_lt05_mababedepr_199407_rgb-bands.tif

#Use ImageMagick to quantisize to 256 colors
convert natcol_lt05_mababedepr_199407_rgb-bands.tif +dither  -colors 255  natcol_lt05_mababedepr_199407_byte.png

#Convert back to Geotiff tiff
/Library/Frameworks/GDAL.framework/Versions/2.4/Programs/gdal_translate -a_srs EPSG:32734 -a_ullr 794240.0542575517902151 7960587.5265753660351038 880258.8149869333719835 7859056.2679800735786557 natcol_lt05_mababedepr_199407_byte.png natcol_lt05_mababedepr_199407_byte.tif
Mkgadikgadi Ridge Region
Also for the Mkgadikgadi Ridge Region a special DEM was created back in 2000.
#Shoreline point data
/Library/Frameworks/GDAL.framework/Versions/2.4/Programs/ogr2ogr -s_srs "+proj=utm +zone=34 +south +ellps=clrk80 +units=m +no_defs" -t_srs EPSG:32734 elev-pt-palaeo-shore_karttur_mkgadiridge_0_v2001.shp "/Volumes/karttur/oka-dem-more/arcview/mkgadi_dem_points.shp"

#Palaeo shoreline
/Library/Frameworks/GDAL.framework/Versions/2.4/Programs/ogr2ogr -s_srs "+proj=utm +zone=34 +south +ellps=clrk80 +units=m +no_defs" -t_srs EPSG:32734 palaeo-shore-arc_karttur_mkgadiridge_0_pos-from-lt05.shp "/Volumes/karttur/oka-dem-more/arcview/mkgadi_shore.shp"

#mkgadi_isodist.shp: Mkgadi ISO dist from Boteti
/Library/Frameworks/GDAL.framework/Versions/2.4/Programs/ogr2ogr -s_srs "+proj=utm +zone=34 +south +ellps=clrk80 +units=m +no_defs" -t_srs EPSG:32734 isodist_karttur_mkgadiridge_0_centreline.shp "/Volumes/karttur/oka-dem-more/arcview/mkgadi_isodist.shp"

#mkgadi_contours.shp: This are the isohyeths from the DEM, without added other stuff
/Library/Frameworks/GDAL.framework/Versions/2.4/Programs/ogr2ogr -s_srs "+proj=utm +zone=34 +south +ellps=clrk80 +units=m +no_defs" -t_srs EPSG:32734 elev-contours_karttur_mkgadiridge_0_v2001.shp "/Volumes/karttur/oka-dem-more/arcvie/mkgadi_contours.shp"

#mababe_grav_tm.shp: The data used for generation Ngami DEM
/Library/Frameworks/GDAL.framework/Versions/2.4/Programs/ogr2ogr -s_srs "+proj=utm +zone=34 +south +ellps=clrk80 +units=m +no_defs" -t_srs EPSG:32734 elev-pt_gps_mkgadiridge_1999_grav-survey.shp "/Volumes/karttur/oka-dem-more/arcview/grav_tm_mkgadi.shp"

#DEM
/Library/Frameworks/GDAL.framework/Versions/2.4/Programs/gdalwarp -tr 500 500 -overwrite -s_srs "+proj=utm +zone=34 +south +ellps=clrk80 +units=m +no_defs" -t_srs EPSG:32734 /Volumes/karttur/oka-dem-more/arcview/mkgadi_dem demtemp.tif
/Library/Frameworks/GDAL.framework/Versions/2.4/Programs/gdal_translate -a_ullr 830288.515 7816312.742 885794.137 7669802.090 demtemp.tif dem_karttur_mkgadiridge_0_pub.tif

#the error raster, for some strange, but unknown, reason is one row and one column smaller and must be fitted.
/Library/Frameworks/GDAL.framework/Versions/2.4/Programs/gdalwarp -overwrite -s_srs "+proj=utm +zone=34 +south +ellps=clrk80 +units=m +no_defs" -t_srs EPSG:32734 /Volumes/karttur/oka-dem-more/arcview/mkgadi_err errtemp.tif
/Library/Frameworks/GDAL.framework/Versions/2.4/Programs/gdal_translate -a_ullr 830288.515 7815812.742 885294.137 7669802.090 errtemp.tif dem-sd_karttur_mkgadiridge_0_pub.tif

#Mababe pleasing image at 28 m  (from ecw - only source I can find)
/Library/Frameworks/GDAL.framework/Versions/2.4/Programs/gdalwarp -overwrite -s_srs "+proj=utm +zone=34 +south +ellps=clrk80 +units=m +no_defs" -t_srs EPSG:32734 /Volumes/tgdata/old_CDs/okavango/okaCD1.1/OKAVANGO/Delta/landcover/graphics/mkgadikgadi_pleasing_tm.ecw natcol_lt05_mababedepr_199407_rgb-bands2.tif

#Use ImageMagick to quantisize to 256 colors
convert natcol_lt05_mababedepr_199407_rgb-bands2.tif +dither  -colors 255  natcol_lt05_mababedepr_199407_byte.png

#Convert back to Geotiff tiff
/Library/Frameworks/GDAL.framework/Versions/2.4/Programs/gdal_translate -a_srs EPSG:32734 -a_ullr 794240.0542575517902151 7960587.5265753660351038 880258.8149869333719835 7859056.2679800735786557 natcol_lt05_mababedepr_199407_byte.png natcol_lt05_mababedepr_199407_byte.tif
Okavango swamps water level DEM
The source data for generating the water surface DEM, from surveys done by Univeristy of Capte Town, are imported with python function CheckFixDBFwaterElevIni. A text file is used for defining source and destionation layers (dem_gen_water_shape_files.txt):
/Volumes/karttur/oka-dem-fixed/dem_ptdata/uct_gps_h2o_94/uct_gps_h2o_94.shp,/Volumes/karttur/okavango/dem/oka_water/elev-pt-water_gps-uct_okaswamps_1994_v2001.shp

/Volumes/karttur/oka-dem-fixed/dem_ptdata/uct_gps_h2o_95_tm/uct_gps_h2o_95_tm.shp,/Volumes/karttur/okavango/dem/oka_water/elev-pt-water_gps-uct_okaswamps_1995_v2001.shp

/Volumes/karttur/oka-dem-fixed/dem_ptdata/uct_gps_h2o_96/uct_gps_h2o_96.shp,/Volumes/karttur/okavango/dem/oka_water/elev-pt-water_gps-uct_okaswamps_1996_v2001.shp

/Volumes/karttur/oka-dem-fixed/dem_ptdata/uct_gps_h2o_98_tm/uct_gps_h2o_98_tm.shp,uct_gps_h2o_98_tm/Volumes/karttur/okavango/dem/oka_water/elev-pt-water_gps-uct_okaswamps_1998_v2001.shp
The attribute table fixing is hardcoded in python and you can not change the source file names, then it does not work.
Resources
Github repositories with scripts for re-organizing the Okavango spatial data