Results
This post presents the graphical results of the Vertical Water Balance (VWB) analysis for Sub-Saharan Africa. The processing for deriving the images and movies are presented in the previous post.
Monthly VWB
The three movies below are constructed from all the VWB dates over Sub-Saharan Africa used in this project. The first movie shows the overall VWB; the second movie the surplus VWB (rainfall exceeding evapotranspiration); and the third movie the deficit VWB (evapotranspiration exceeding rainfall).
VWB annual trends 1998-2017
The VWB statistics and trends are calculated from annually aggregated data.
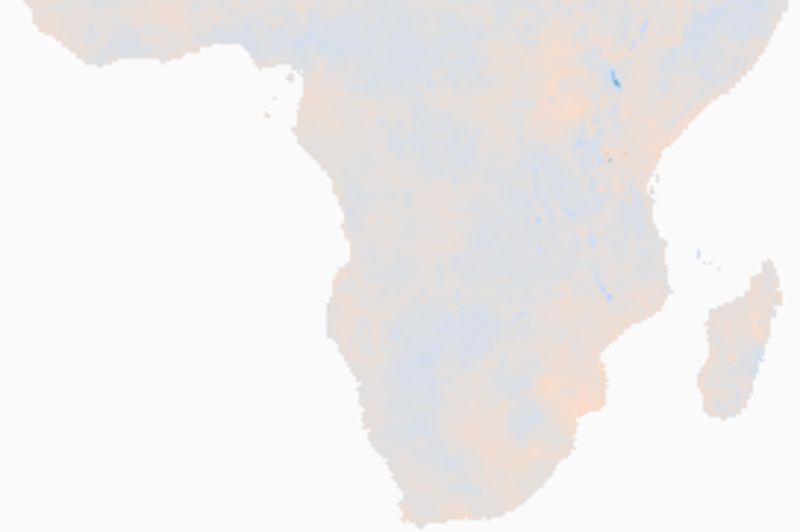
VWB mean
The three panels of the figure of annual mean VWB below show overall VWB, surplus VWB and deficit VWB. Note that regions that have overall surplus VWB, can have periods with deficits (and vice versa) and thus appear in all three panels.

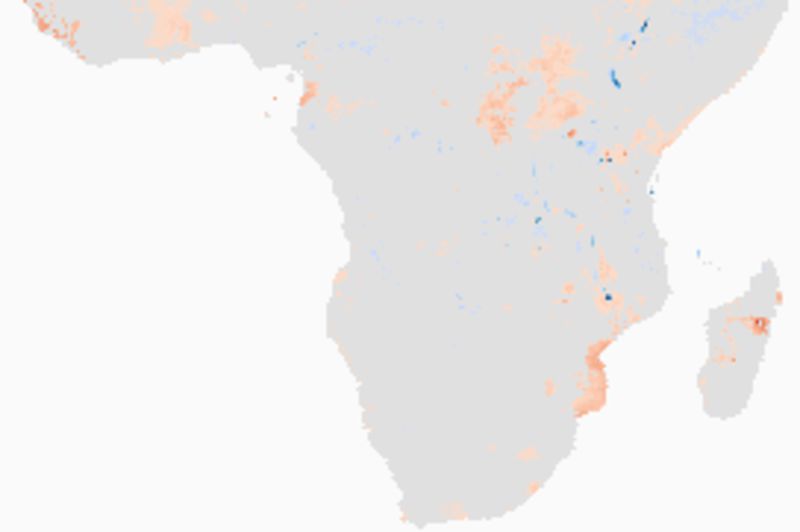
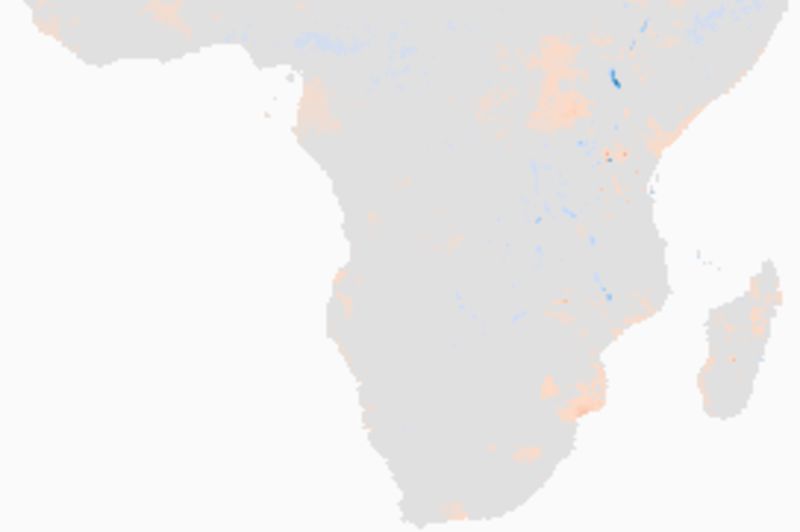
VWB trends
The three panels of the figure of trends in annual VWB below show overall VWB, surplus VWB and deficit VWB. many regions show different trends in wetting/drying when comparing the changes when separating surplus and deficit dominated periods. This is more clearly seen if you click one of the images and view the sequential maps at larger resolution.
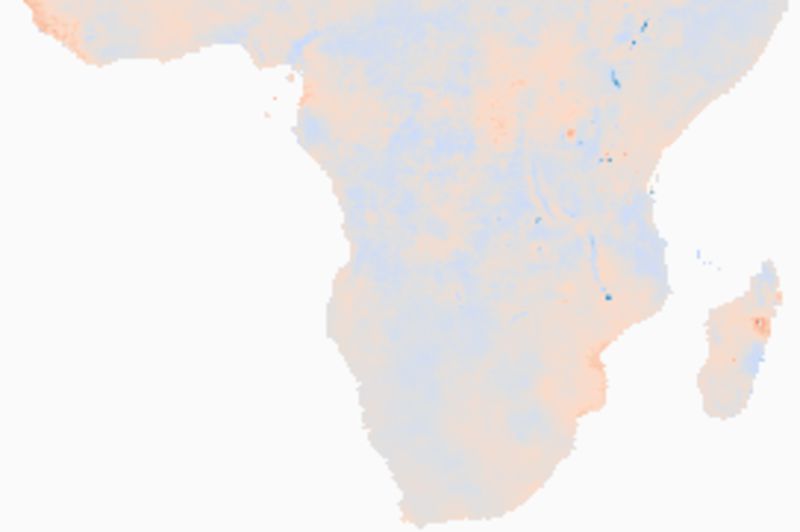
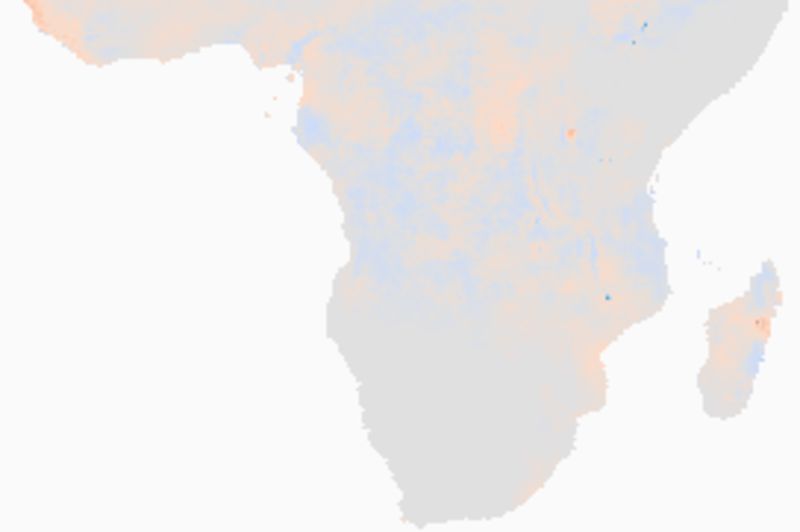
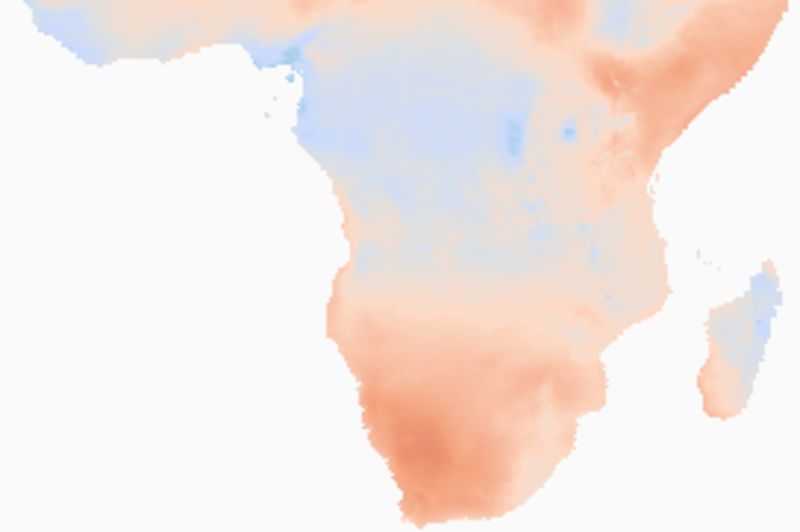
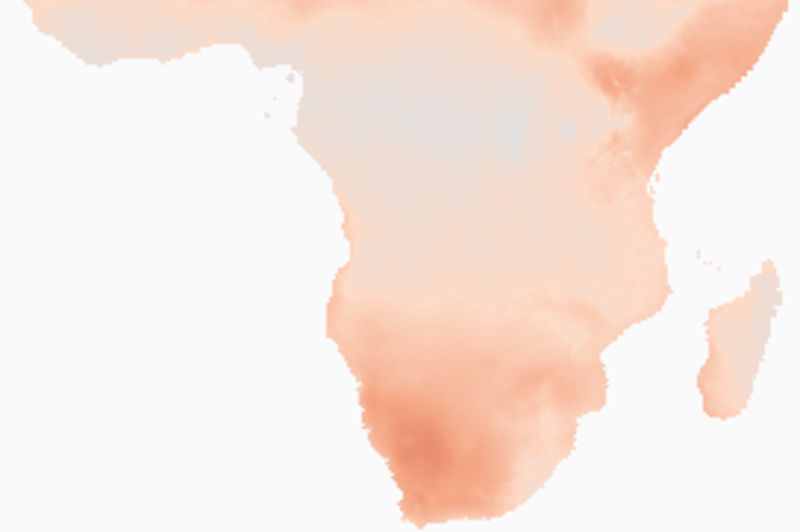
VWB changes and significant trends
In the double row of panels in the figure of changes below, the top row shows the change in VWB between 1998 and 2017 for all regions; the bottom row only shows regions where the change has been significant (Mann-Kendall p<0.05). From left to right the panels show overall VWB, surplus VWB and deficit VWB. The change are more clearly seen if you click one of the images and view the sequential maps at larger resolution. Perhaps the most apparent result is that the regions with significant drying are much larger than regions with significant wetting.