
Outline
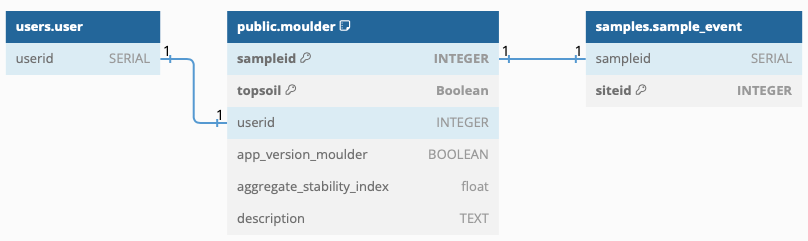
The schema moulder only contains a single table, for recording the results of the Moulder: Soil aggregates open source app. Results from the older versions of the app, called slakes can also be registered in the schema.
The soil sampling, including extraction method, depth, classification, photos etc., are recorded in the schema samples. The landscape (above ground) characteristics and the cultivation methods and its history are covered in the sites, landscape and landsites schemas.
Moulder (slakes)
Moulder: Soil aggregates is an open source mobile app available on Google Play and Apple App Store.
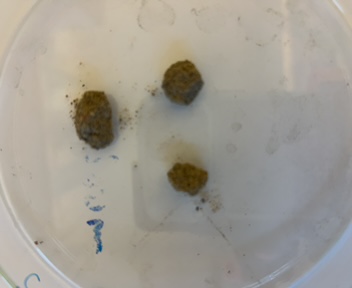
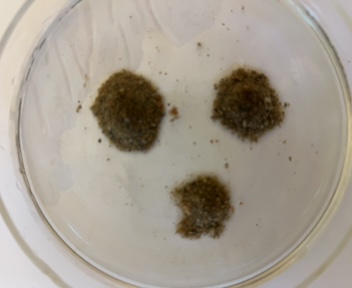
The measurement of the soil aggregate stability rely on the mobile phone camera. The light settings to separate the soil aggregrates from the background can be tricky and you might need to try different light conditions before the app is able to separate the soil aggregates from the (white) background.
The app records the results in a folder under documents on your phone. The path to the folder of your results depend on whether you used moulder or slakes:
./documents/slakes/SoilHealthTestResultsExport_YYYY-MM-DD_HH-MM_SS
Each experiment generate a set of csv files with the results and also the images used for the analysis:
|____ImageData.csv
|____Sample_hdd_YYYY-MM-DD_hh-mm_ss
| |____Initial_mask.jpg
| |____Final_crop.jpg
| |____Initial_bw.jpg
| |____Second_crop.jpg
| |____Second_bw.jpg
| |____Description.csv
| |____Initial_crop.jpg
| |____Final_mask.jpg
| |____Initial_original.jpg
| |____Second_mask.jpg
| |____Final_original.jpg
| |____Second_original.jpg
| |____Final_bw.jpg
|____SampleSummary.csv
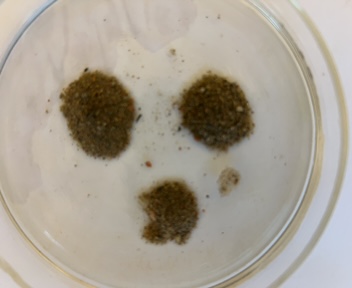
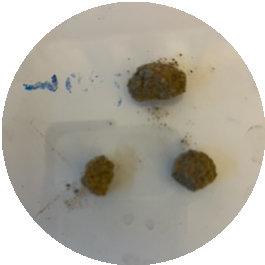
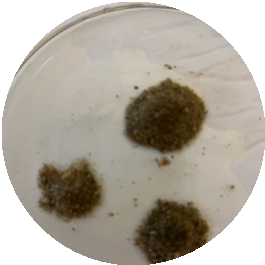
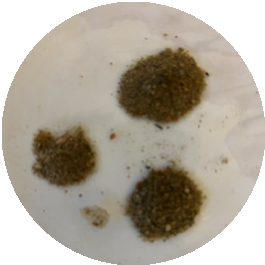
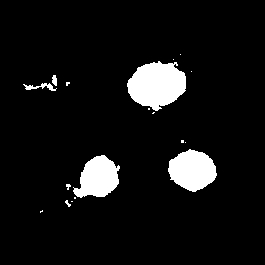
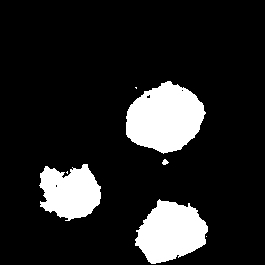

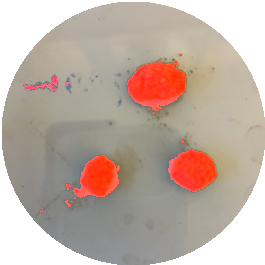
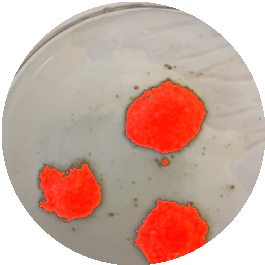
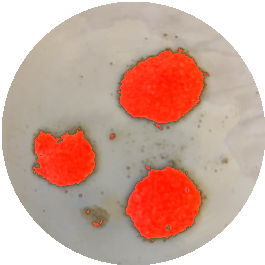
slakes generates 3 csv documents:
- SampleSummary.csv
- ImageData.csv
- Sample_hdd_YYYY-MM-DD_hh-mm_ss/Descriptions.csv
The only data that is transferred to the database is the Aggregate Stability Index (ASI) from the file SampleSummary.csv:
Aggregate Stability Index Values

Sample Name,Time Stamp,Aggregate Stability Index,Error State
sample-name,03/22/2024 09:55,0.48,None
or in more readable tabular form:
| Sample Name | Time stamp | Aggregate Stability Index | Error State |
| “sample-name” | 03/22/2024 09:55 | 0.48 | None |
DBML
// Use DBML to define your database structure
// Docs: https://dbml.dbdiagram.io/docs
// Tool: https://dbdiagram.io/d

Project project_name {
  database_type: 'PostgreSQL'
  Note: 'AI4SH schema for moulder measurements'
}

Table users.user {
  userid SERIAL
}

Table samples.sample_event {
  sampleid SERIAL
  siteid INTEGER [pk]
}

Table moulder {
  sampleid INTEGER [pk]
  topsoil Boolean [pk]
  userid INTEGER
  app_version_moulder BOOLEAN
  aggregate_stability_index float
  description TEXT
}
// topsoil (true) represents 0-20 cm, subsoil (false) represents 20-50 cm.

REF: samples.sample_event.sampleid - moulder.sampleid
REF: users.user.userid - moulder.userid
Figure